Next-Level Interactivity in AI/BI Dashboards

As recently announced at this year’s Data and AI Summit, Databricks AI/BI democratizes business intelligence and analytics across your organization with highly visual and interactive low-code AI/BI Dashboards and no-code conversational analytics powered by AI/BI Genie. In this blog, we are excited to showcase a number of new features that enhance the performance and interactivity of AI/BI Dashboards.
Highly interactive (or clickable) business intelligence dashboards are table stakes these days. They are essential because they enable dashboard users to explore data dynamically, customizing insights with every click. This allows them to ask follow-up questions of their data and make more informed decisions much faster, unlike static dashboards that limit exploration and problem-solving through analytics.
Key improvements that we will cover in this blog include:
- Cross-Filtering: You can now click on interesting data points in a visualization to filter your dashboard and see the impact on other key metrics and visuals. This helps you explore your data to understand relationships and correlations that uncover new insights.
- Static Widget Parameters: Create multiple filtered visualizations that highlight different aspects of your data. For example, build two charts focusing on sales, one from the current year and one from the previous year. With static widget parameters, you can build visualizations from a single parameterized dataset without needing to create a custom dataset per visualization.
- Filter Default Values: Focus viewers on specific data or context within a dashboard by setting default filter values that apply on initial load.
- Improved Performance: Nobody likes dashboards that lock up or tell you to “please wait” every time you open them or click on an interesting data point. To that end, we have added several performance enhancements to ensure users get lightning-fast interactive dashboards so they can ask follow-on questions of their data without running additional SQL queries.
- Query-Based Parameters: Dashboard authors should be able to create expressive experiences with both field and parameter filters. By allowing the combination of parameters and fields in a single filter, we've enabled new capabilities, such as dynamically populating a parameter dropdown with query results.
Cross-Filtering
When exploring a dashboard, specific data points in a visualization may stand out for further investigation. While some filters may already be in place, they may not anticipate every viewer's needs.
With cross-filtering, every chart can now be used to filter your data. Simply click on visualizations to filter the dashboard and explore the data more deeply. Cross-filtering is automatically enabled for all visualizations that share the same dataset, meaning you can click on one part of a visualization (like a bar in a bar chart) to filter the data across all related visualizations in the dashboard.
Slice through your data and focus your analysis by clicking on outliers, such as visually distinct marks in a heatmap.
Navigate hierarchical data by drilling down through aggregated visualizations. For example, click on yearly data to restrict other charts to that year’s data. Click on bars in month-level and week-level charts to continue drilling down.
Currently available for bar charts, heatmaps, pie charts, and scatter plots, cross-filtering complements existing field and parameter filters. Support for additional visualizations, including histograms, line charts, area charts, combo charts, and multi-value selection, is coming soon.
Static Widget Parameters
Building dashboards is easier with fewer datasets. Cloning a dataset just to add another filter or aggregate for a specific visualization introduces clutter and friction
Static widget parameters simplify this process by allowing you to customize filters for each visualization without creating separate filtered datasets. This feature complements the existing ability to define per-visualization aggregates and bins.
For example, to highlight temperature metrics for different locations using a single dataset, you can augment it with a condition like:
Next, simply set a different static parameter value for each new visualization. In the example below, you can see three charts: one for all locations, one for Seattle and one for New York. Each chart uses the same dataset, but different static values are applied to filter the data accordingly.
We're working on extending this functionality to support per-widget filtering using fields. For example, you could filter each chart on the location field without needing to parameterize the underlying dataset.
Default Values
As a dashboard author, you might want to guide viewers to a specific data slice, such as a particular date range or location.
With default values, you can set specific filter values that apply on initial dashboard load or when selections are reset. This ensures that viewers focus on the key data points from the start. Default values complement the existing ability to preserve dashboard filter selections by sharing a URL of your current view.
For example, snow days are interesting because they have extreme temperatures and high precipitation. Setting the default weather filter to ‘snow’ will encourage new dashboard viewers to explore this weather type first. After reviewing other weather trends, they can reset the filter to continue their deep dive into snow days.
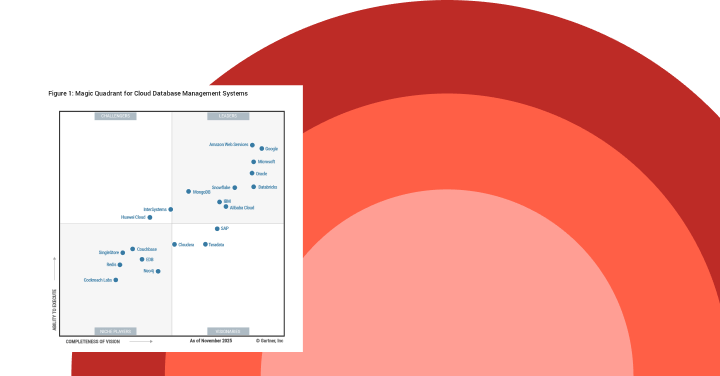
Gartner®: Databricks Cloud Database Leader
Improved Performance
For an interactive dashboard to truly be delightful, it must be fast. Waiting for queries to run with each filter application can disrupt the flow of analysis.
AI/BI Dashboards are optimized for high performance, even with large data, through techniques like query caching and deep platform integration. Query caching automatically stores the query results for 24 hours, ensuring faster performance by leveraging previously executed queries. You can also proactively populate the cache through schedules.
In addition to delivering fast initial load, AI/BI Dashboards provide near-instant interactivity for smaller datasets by evaluating filters in the browser rather than re-executing queries on every change.
We recently increased the client-side filter evaluation limit to 100K rows. This means that for datasets within this limit, the entire dataset is queried once, and all subsequent filtering is handled client-side, eliminating the need for additional server-side queries. Even with large tables, techniques like pre-aggregation with materialized views can create smaller, faster-filtering datasets.
We generally recommend filtering on fields rather than parameters, which always require server-side queries. Parameters are best suited for cases that filtering on fields can't yet handle, like filtering in subqueries or defining datasets with complex aggregates.
We continue to explore additional optimizations such as further increasing the client-side filter limit. Upcoming features such as visualization-level calculations will increase the number of use cases that can be fully achieved through filtering on fields.
Query-Based Parameters
Parameters are a powerful tool because they can be introduced anywhere in a dataset’s SQL, offering maximum flexibility when defining filters. Although parameters are placeholders for literals in SQL, they should act like any other field, allowing authors to populate dropdowns and other filters used to configure their values.
By enabling the mixing of parameters and fields, we’ve added the ability to populate parameter filters with values from other datasets. This approach to query-based parameter values unlocks advanced analysis capabilities, such as dynamically changing date granularities.
For example, you can enable drilling down through different date granularities by parameterizing the DATE_TRUNC function used for aggregation. The resulting dataset and metrics are aggregated, which means that adding an additional weather filter also requires parameterizing the query.
Dashboard viewers should be able to easily choose valid values in their filter dropdowns. For example, they should not need to guess if “YEAR” or “YEARLY” is the correct literal for date truncation. To populate the dropdowns correctly, create the following two datasets
Modify the date granularity and weather parameter filters to reference the fields in these dataset to populate the dropdowns and start drilling down through dates.
Combining fields and parameters in a single widget also lets you use one filter to control multiple datasets, regardless of whether those datasets use parameters or field filters.
We're looking forward to providing even more flexibility in field and parameter filtering with upcoming features like date range parameters and multi-value parameters.
Learn More About AI/BI Dashboards
As we've demonstrated, AI/BI Dashboards are a significant area of investment for Databricks, with interactivity being a key focus. We encourage you to explore these new features and see how they can elevate your own dashboards. Check out the Databricks documentation around AI/BI Dashboards, including deep dives on parameters and filters.
Your feedback is invaluable as we continue to refine and expand our AI/BI Dashboards. We look forward to hearing your thoughts and suggestions!