Parsing Improperly Formatted JSON Objects in the Databricks Lakehouse

Introduction
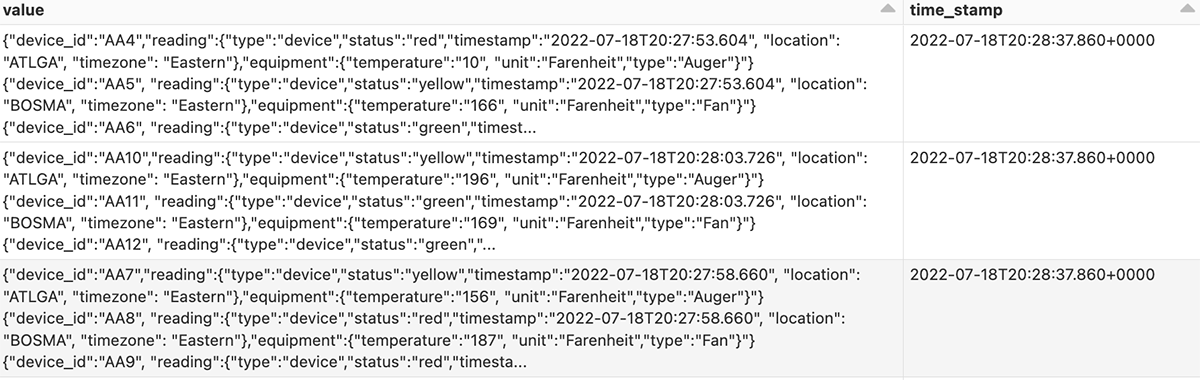
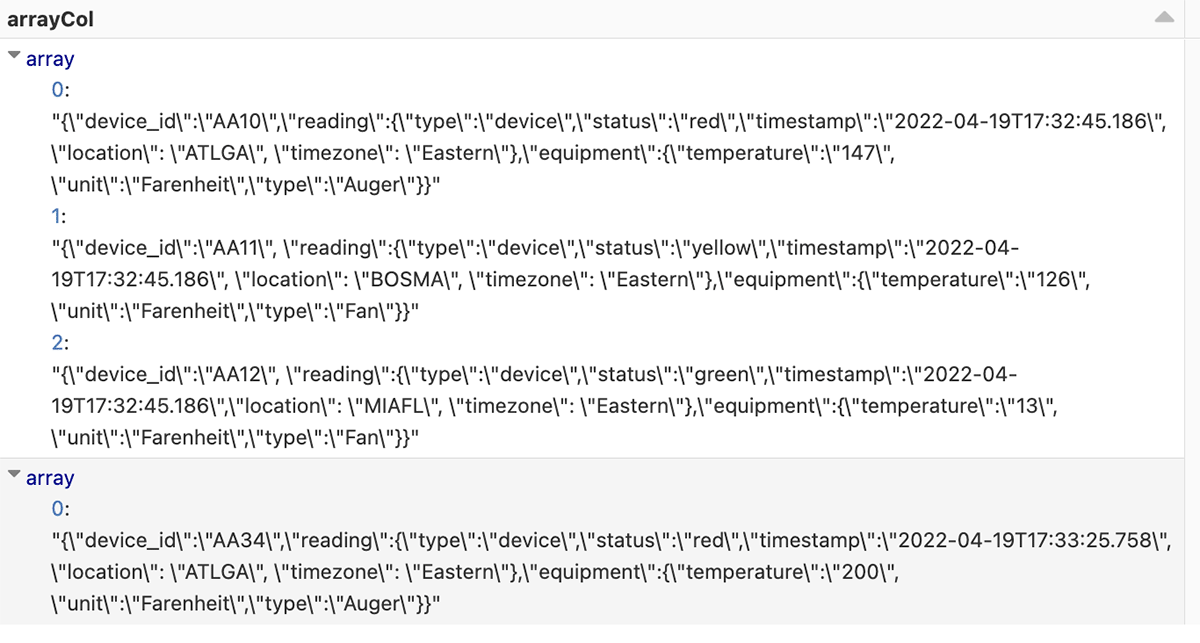
When working with files, there may be processes generated by custom APIs or applications that cause more than one JSON object to write to the same file. The following is an example of a file that contains multiple device IDs:
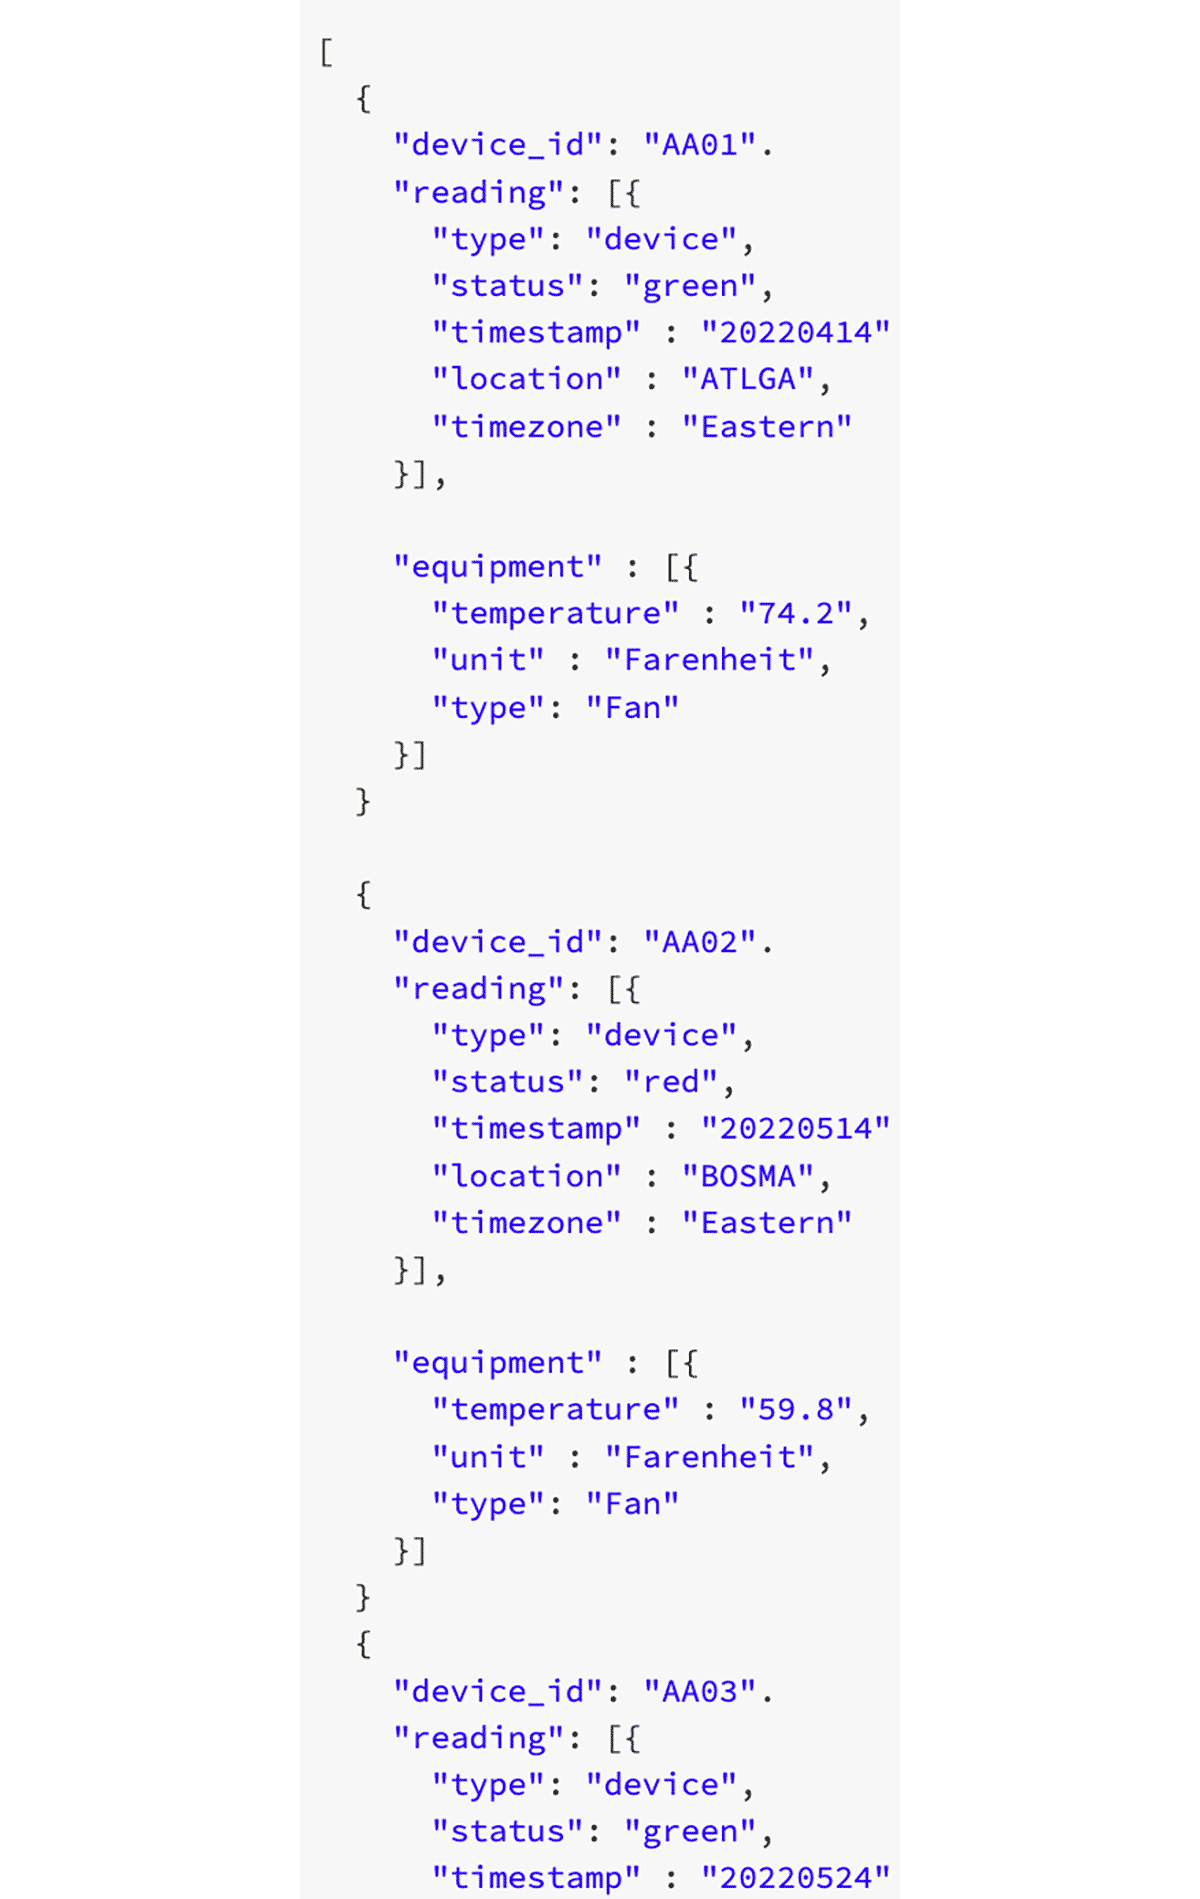
There's a generated text file that contains multiple device readings from various pieces of equipment in the form of JSON object, but if we were to try to parse this using the json.load() function, the first line record is treated as the top-level definition for the data. Everything after the first device-id record gets disregarded, preventing the other records in the file from being read. A JSON file is invalid if it contains more than one JSON object when using this function.
The most straightforward resolution to this is to fix the formatting at the source, whether that means rewriting the API or application to format correctly. However, it isn't always possible for an organization to do this due to legacy systems or processes outside its control. Therefore, the problem to solve is to take an invalid text file with valid JSON objects and properly format it for parsing.
Instead of using the PySpark json.load() function, we'll utilize Pyspark and Autoloader to insert a top-level definition to encapsulate all device IDs and then load the data into a table for parsing.
Databricks Medallion Architecture
The Databricks Medallion Architecture is our design pattern for ingesting and incrementally refining data as it moves through the different layers of the architecture:
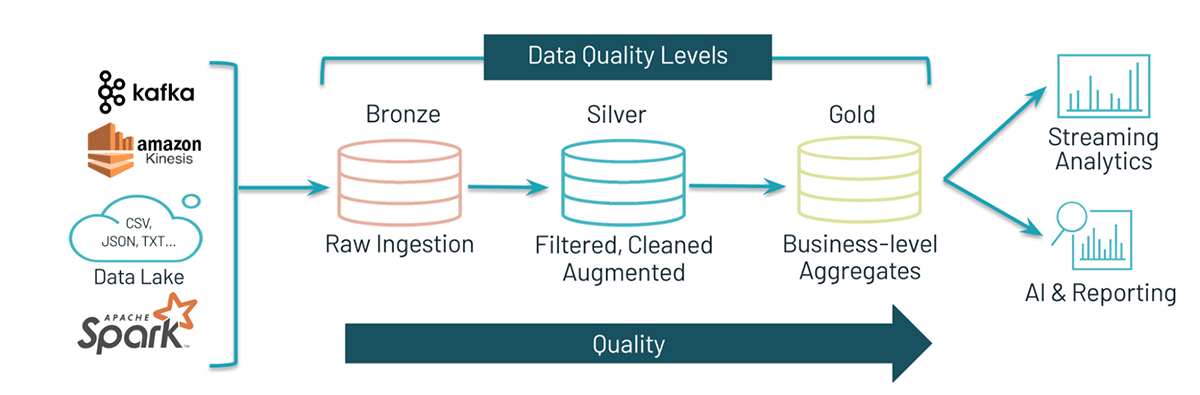
The traditional pattern uses the Bronze layer to land the data from external source systems into the Lakehouse. As ETL patterns are applied to the data, the data from the Bronze layer is matched, filtered, and cleansed just enough to provide an enterprise view of the data. This layer serves as the Silver layer and is the starting point for ad-hoc analysis, advanced analytics, and machine learning (ML). The final layer, known as the Gold layer, applies final data transformations to serve specific business requirements.
This pattern curates data as it moves through the different layers of the Lakehouse and allows for data personas to access the data as they need for various projects. Using this paradigm, we will use pass the text data into a bronze layer, then using
The following walks through the process of parsing JSON objects using the Bronze-Silver-Gold architecture.
Part 1:
Bronze load
Bronze Autoloader stream
Databricks Autoloader allows you to ingest new batch and streaming files into your Delta Lake tables as soon as data lands in your data lake. Using this tool, we can ingest the JSON data through each of the Delta Lake layers and refine the data as we go along the way.
With Autoloader, we could normally use the JSON format to ingest the data if the data was formatted in a proper JSON format. However, because this is improperly formatted, Autoloader will be unable to infer the schema.
Instead, we use the 'text' format for Autoloader, which will allow us to ingest the data into our Bronze table and later on apply transformations to parse the data. This Bronze layer will insert a timestamp for each load, and all of the file's JSON objects contained in another column.
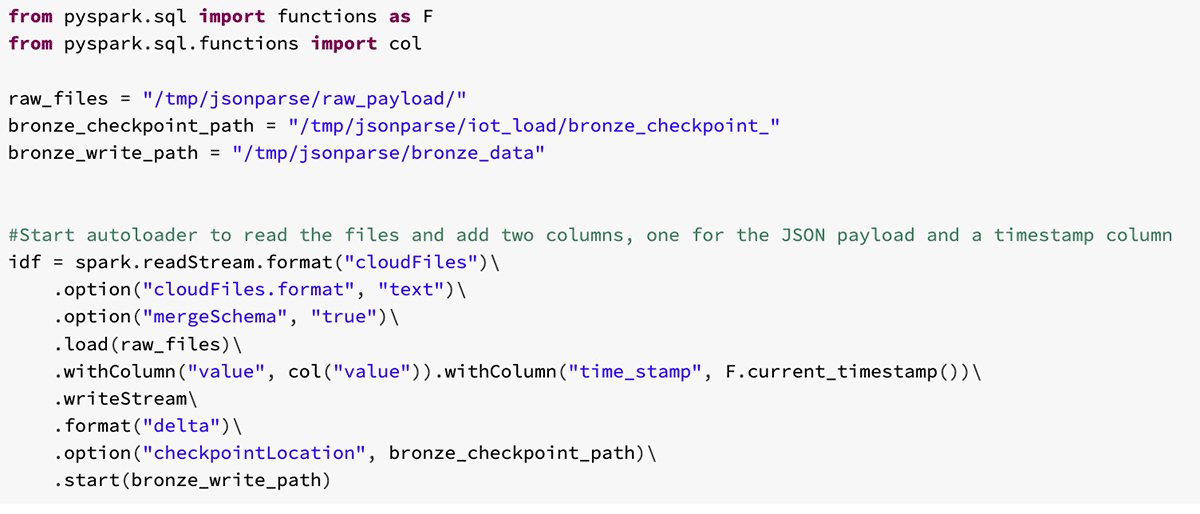

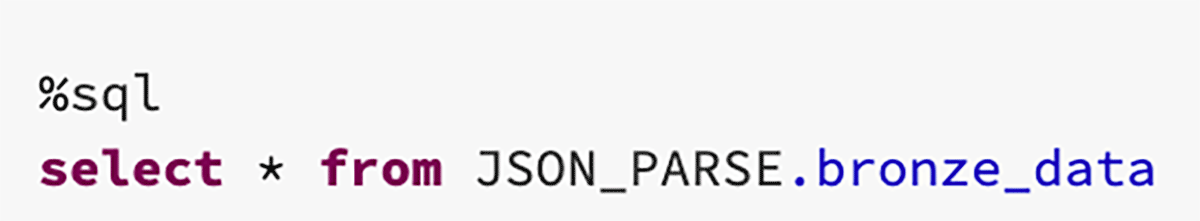
In the first part of the notebook, the Bronze Delta stream is created and begins to ingest the raw files that land in that location. After the data is loaded into the Bronze Delta table, it's ready for loading and parsing into the Silver Table.
A Hands-On Guide to Apps on Databricks
Part 2:
Silver load
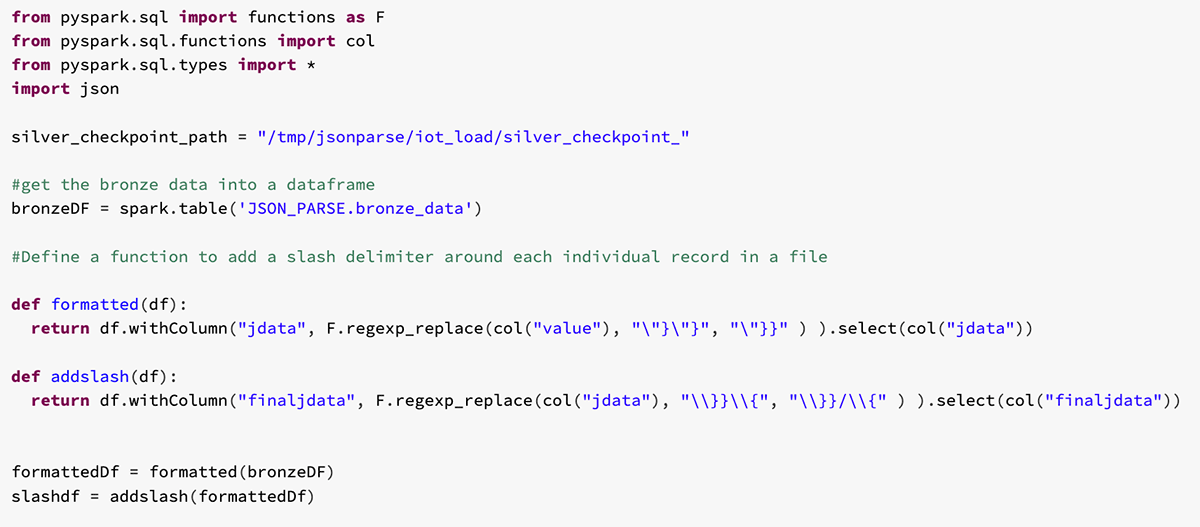
Now that the data is loaded into the Bronze table, the next part of moving the data through our different layers is to apply transformations to the data. This will involve using User-Defined Functions (UDF) to parse the table with regular expressions. With the improperly formatted data, we'll use regular expressions to wrap brackets around the appropriate places in each record and add a delimiter to use later for parsing.
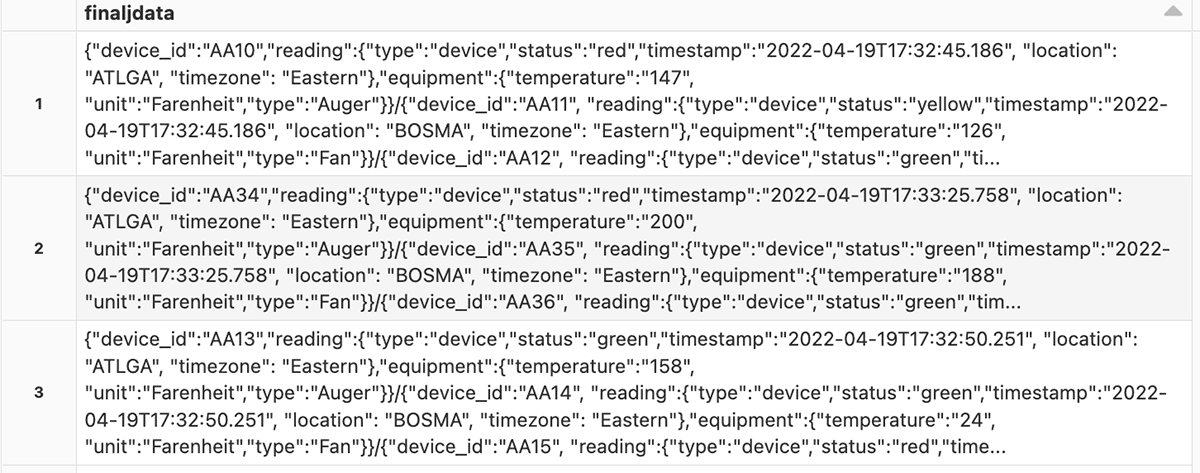
Add a slash delimiter
Results:
Split the records by the delimiter and cast to array
With these results, this column can be used in conjunction with the split function to separate each record by the slash delimiter we've added and cast each record to a JSON array. This action will be necessary when using the explode function later:

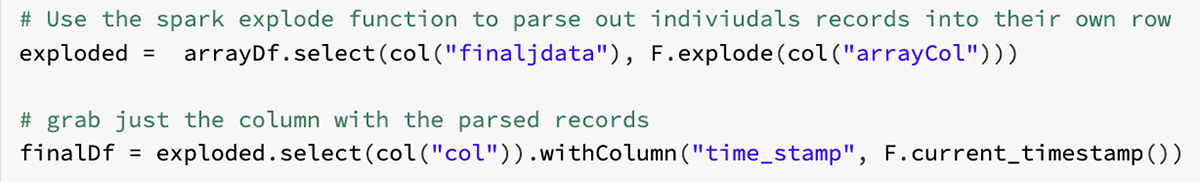
Explode the Dataframe with Apache Spark™
Next, using the explode function will allow the arrays in the column to be parsed out separately in separate rows:
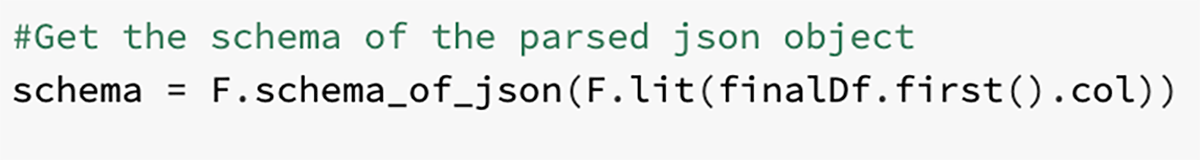
Grab the final JSON object schema
Finally, we used the parsed row to grab the final schema for loading into the Silver Delta Table:
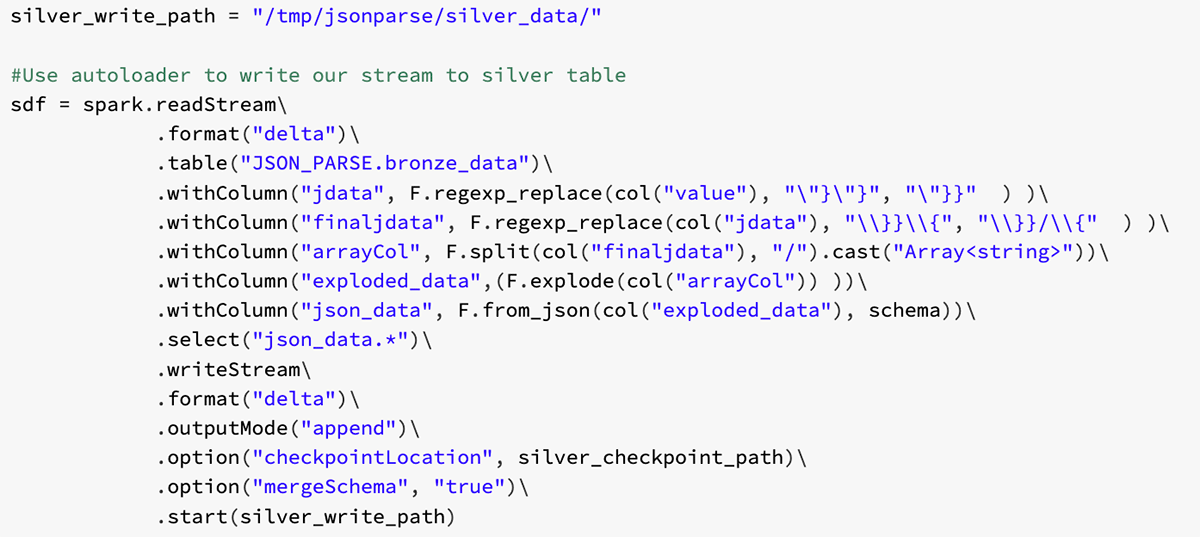
Silver autoloader stream
Using this schema and the from_json spark function, we can build an autoloader stream into the Silver Delta table:
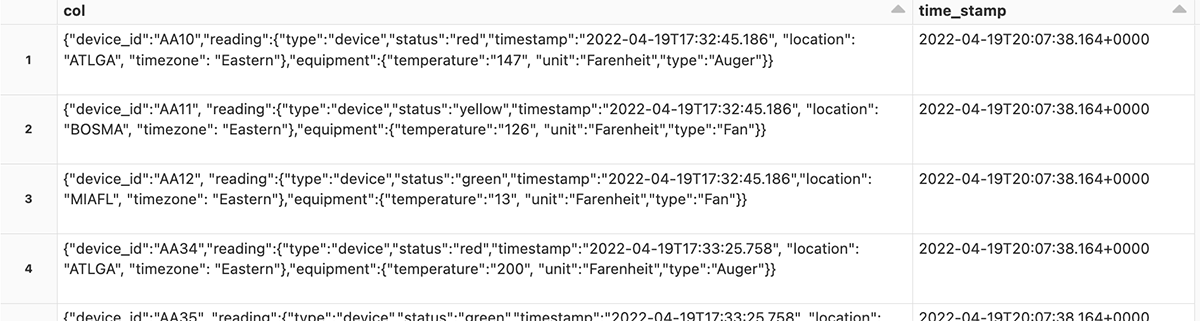
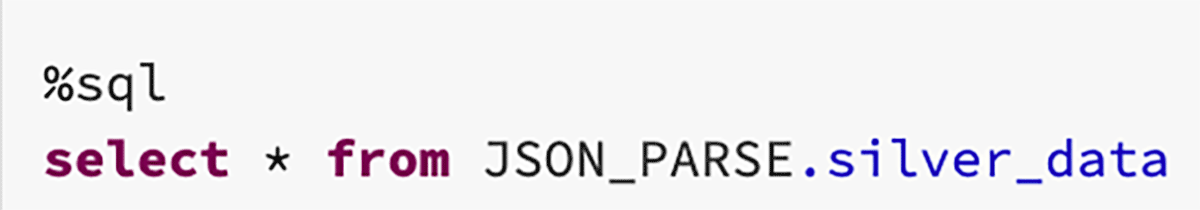
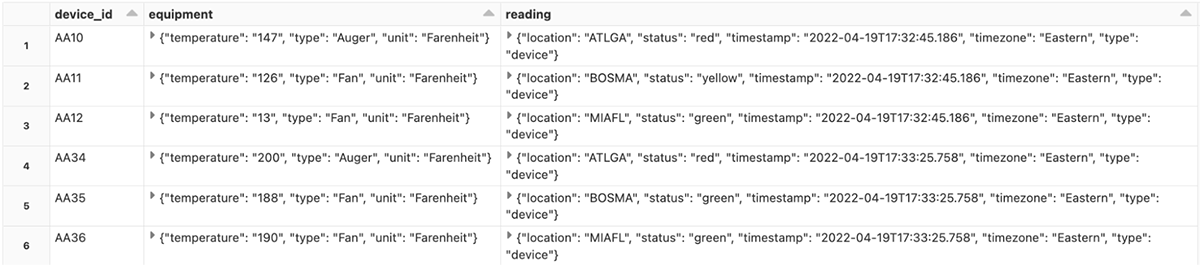
Loading the stream into the Silver table, we get a table with individual JSON records:

Part 3:
Gold load
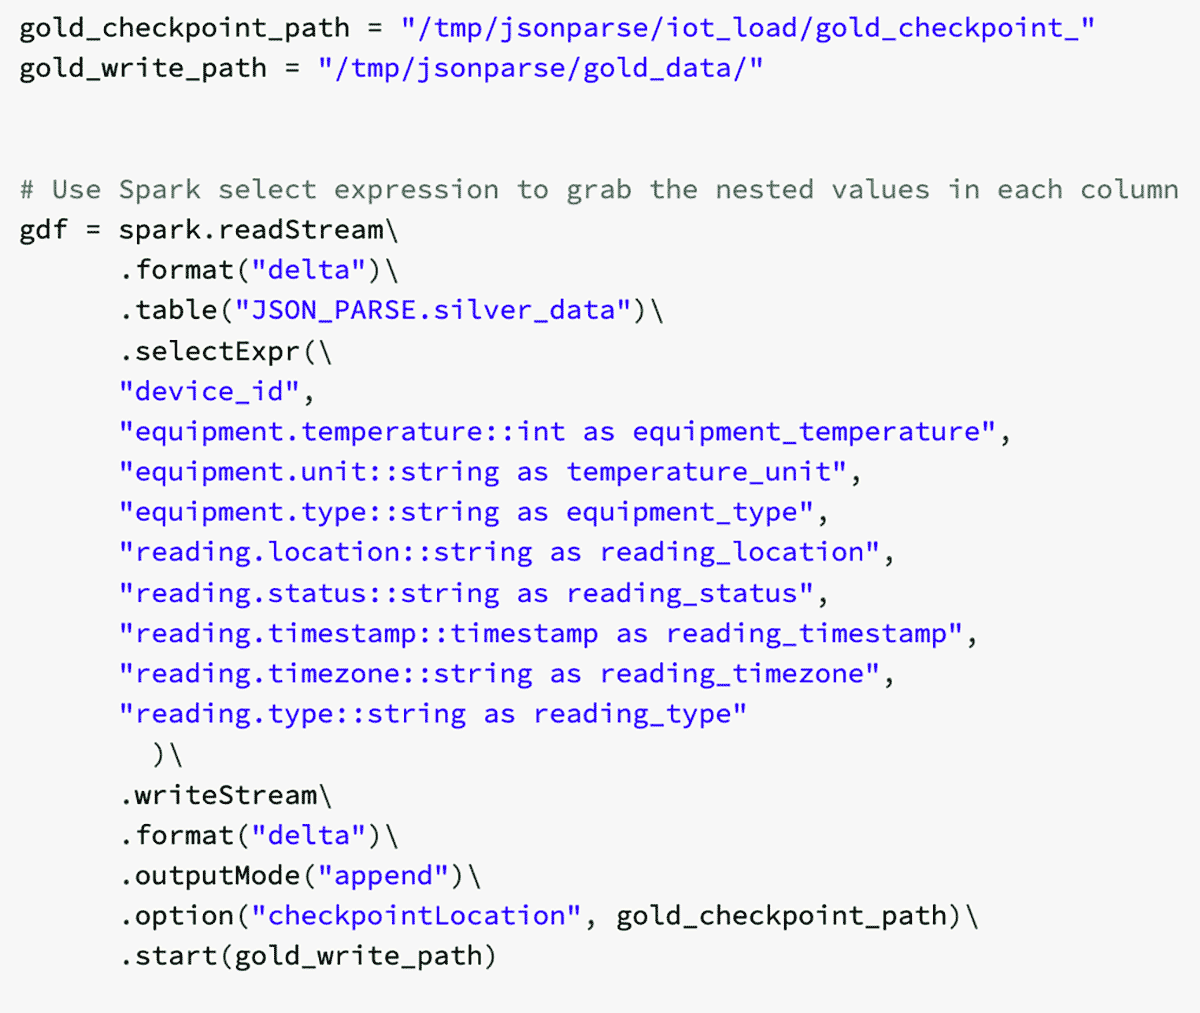
Now that the individual JSON records have been parsed, we can use Spark's select expression to pull the nested data from the columns. This process will create a column for each of the nested values:
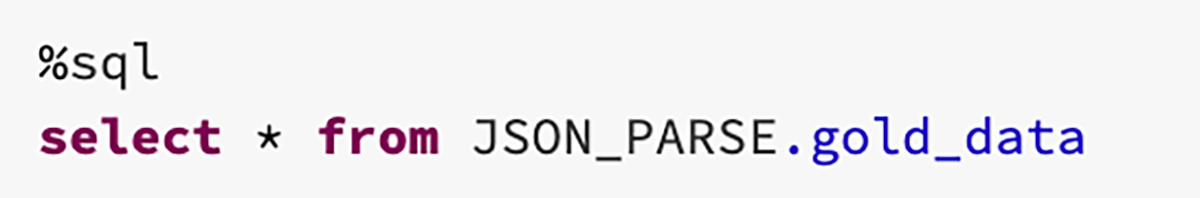
Gold table load
Using this Dataframe, we can load the data into a gold table to have a final parsed table with individual device readings for each row:

Business-Level table build
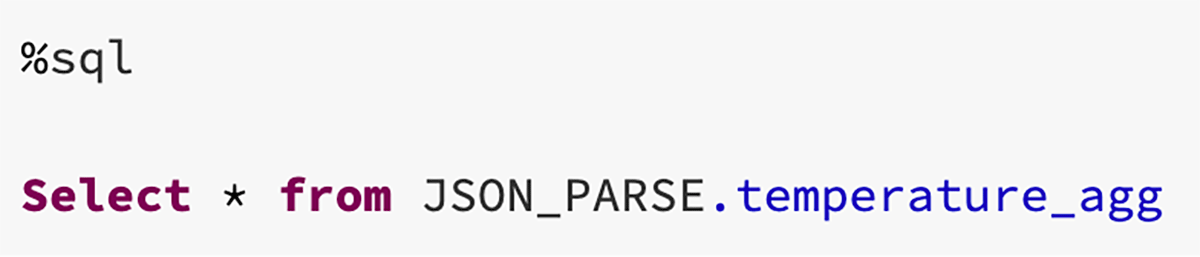
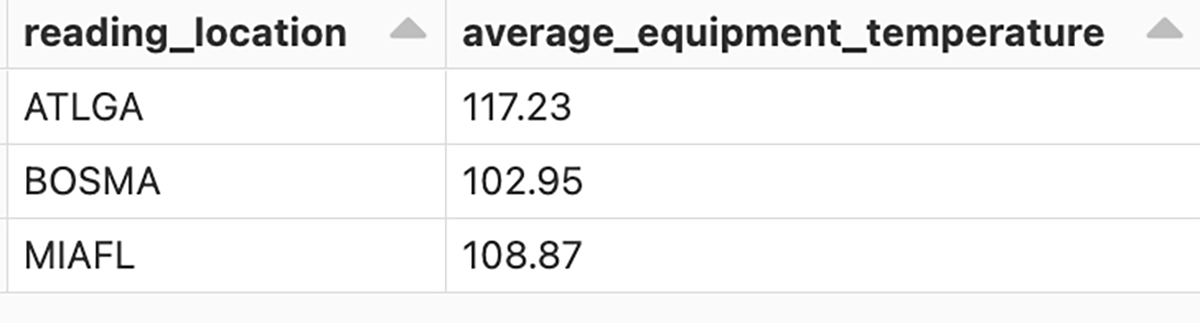
Finally, using the gold table, we'll aggregate our temperature data to get the average temperate by reading location and load it into a business-level table for analysts.
![]()
Aggregate table results
Conclusion
Using Databricks Autoloader with Spark functions, we were able to build an Bronze-Silver-Gold medallion architecture to parse individual JSON objects spanning multiple files. Once loaded into gold tables, the data can then be aggregated and loaded into various business-level tables. This process can be customized to an organization's needs to allow for ease of use for transforming historical data into clean tables.
Try it yourself! Use the attached notebook to build the JSON simulation and use the Bronze-Silver-Gold architecture to parse out the records and build various business-level tables.