Scalable, In-House Quality Measurement with a NCQA-Certified Engine on the Lakehouse

This blog was written in collaboration with David Roberts (Analytics Engineering Manager), Kevin P. Buchan Jr (Assistant Vice President, Analytics), and Yubin Park (Chief Data and Analytics Officer) at ApolloMed. Check out the solution accelerator to download the notebooks illustrating use of the ApolloMed Quality Engine.
At Apollo Medical Holdings (ApolloMed), we enable independent physician groups to provide high-quality patient care at an affordable cost. In the world of value-based care, "quality" is typically defined by standardized measures which quantify performance on healthcare processes, outcomes, and patient satisfaction. A canonical example is the "Transitions of Care" measure, which tracks the percentage of patients discharged from the hospital which receive critical follow up services, e.g. their primary care provider is notified, any new medications are reconciled with their original regimen, and they are promptly seen by a healthcare provider. If any of these events do not occur and the patient meets qualifying criteria, there is a quality "gap", i.e. something didn't happen that should have, or vice versa.
Within value-based contracts, quality measures are tied to financial performance for payers and provider groups, creating a material incentive to provide and produce evidence of high quality care. The stakes are high, both for discharged patients who are not receiving follow-ups and the projected revenues of provider groups, health systems, and payers.
Key Challenges in Managing Quality Gap Closure
Numerous, non-interoperable sources
An organization's quality team may track and pursue gap closure for 30+ distinct quality measures, across a variety of contracts. Typically, the data required to track gap closure originates from a similar number of Excel spreadsheet reports, all with subtly varied content and unstable data definitions. Merging such spreadsheets is a challenging task for software developers, not to mention clinical staff. While these reports are important as the source of truth for a health plan's view of performance, ingesting them all is an inherently unstable, unscalable process. While we all hope that recent advances in LLM-based programming may change this equation, at the moment, many teams relearn the following on a monthly basis…

Poor Transparency
If the quality team is fortunate to have help wrangling this hydra, they still may receive incomplete, non-transparent information. If a care gap is closed (good news), the quality team wants to know who is responsible.
- Which claim was evidence of the follow up visit?
- Was the primary care provider involved, or someone else?
If a care gap remains open (bad news), the quality team directs their questions to as many external parties (payers, health plans) as there are reports. Which data sources were used? Labs? EHR data? Claims only? What assumptions were made in processing them?
To answer these questions, many analytics teams attempt to replicate the quality measures on their own datasets. But how can you ensure high fidelity to NCQA industry standard measures?
Data Missingness
While interoperability has improved, it remains largely impossible to compile comprehensive, longitudinal medical records in the United States. Health plans measuring quality accommodate this issue by allowing "supplemental data submissions", whereby providers submit evidence of services, conditions, or outcomes which are not known to the health plan. Hence, providers benefit from an internal system tracking quality gaps as a check and balance against health plan reports. When discrepancies with health plans reports are identified, providers can submit supplemental data to ensure their quality scores are accurate.
Solution: Running HEDISⓇ Measures on Databricks
At ApolloMed, we decided to take a first principles approach to measuring quality. Rather than rely solely on reports from external parties, we implemented and received NCQA certification on over 20 measures, in addition to custom measures requested by our quality group. We then deployed our quality engine within our Databricks Delta Lake. All told, we achieved a 5x runtime savings over our previous approach. At the moment, our HEDISⓇ engine runs over a million members through 20+ measures for two measurement years in roughly 2.5 hours!
Frankly, we are thrilled with the result. Databricks enabled us to:
- consolidate a complicated process into a single tool
- reduce runtime
- provide enhanced transparency to our stakeholders
- save money
Scaling is Trivial with Pyspark
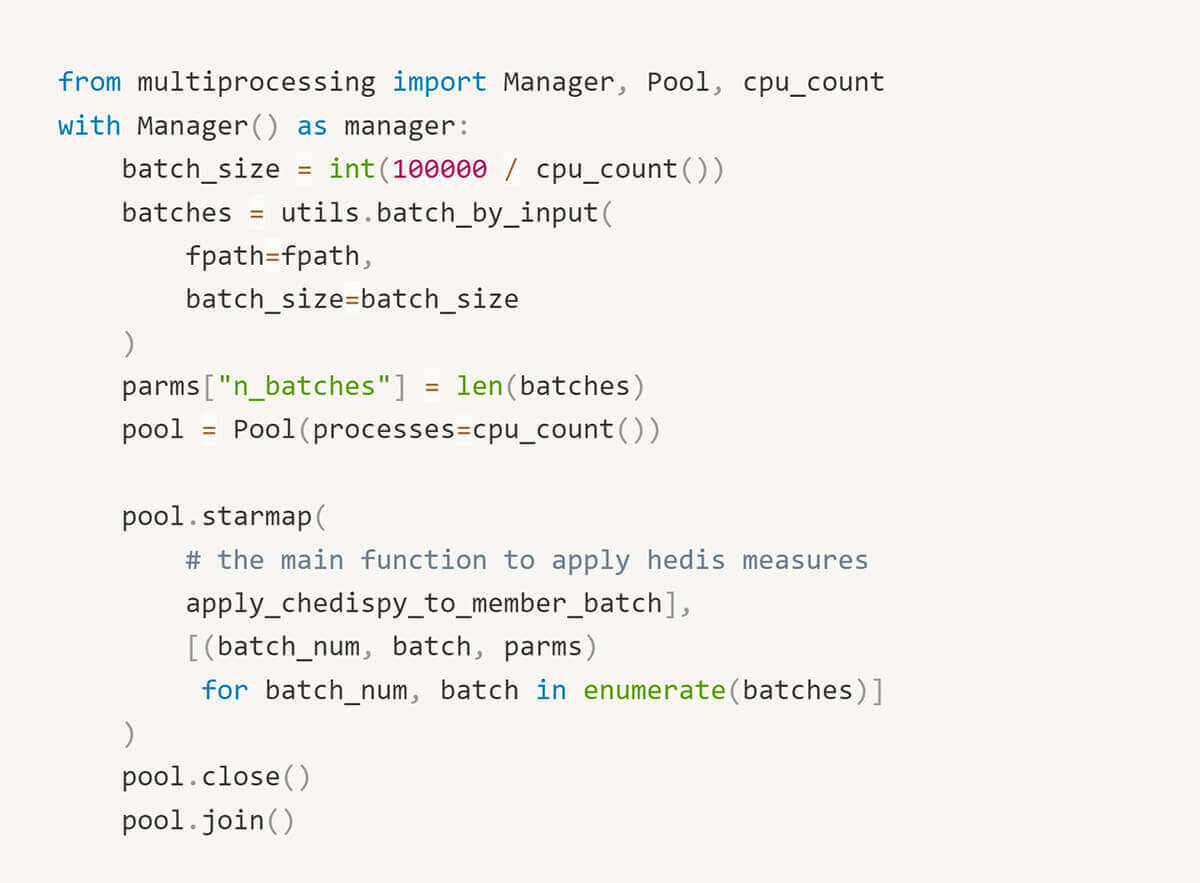
In our previous implementation, an Ubuntu VM extracted HEDISⓇ inputs as JSON documents from an on-prem SQL server. The VM was costly (running 24x7) with 16 CPUs to support Python pool-based parallelization.
With pyspark, we simply register a Spark User-Defined Function (UDF) and rely on the framework to manage parallelization. This not only yielded significant performance benefits, it is simpler to read and communicate to teammates. With the ability to trivially scale clusters as necessary, we are confident our implementation can support the needs of a growing business. Moreover, with Databricks, you pay for what you need. We expect to reduce compute cost by at least 1/2 in transitioning to Databricks Jobs clusters.
Parallel Processing Before…

Parallel Processing After…

Traceability Is Enabled by Default
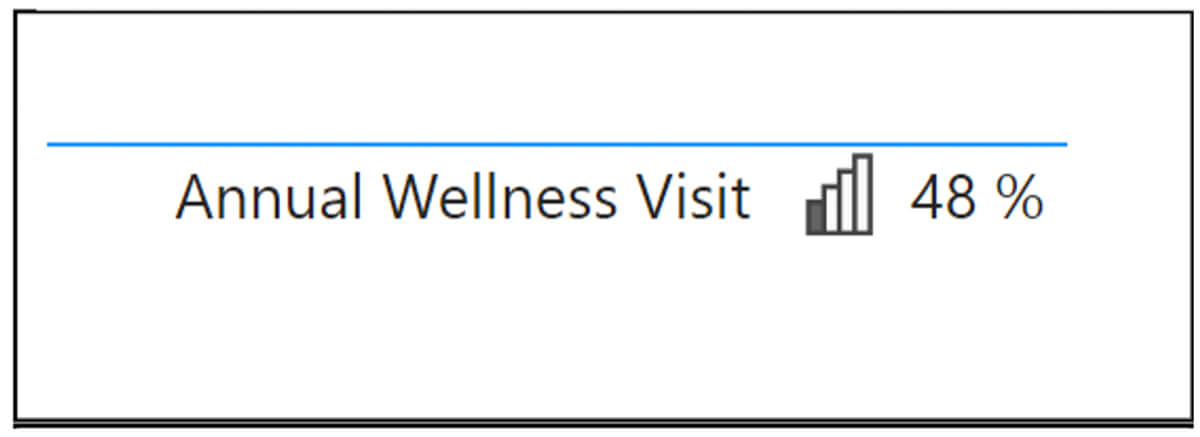
As data practitioners, we are frequently queried by stakeholders to explain unexpected changes. While cumbersome, this task is critical to retaining the confidence of users and ensuring that they trust the data we provide. If we've performed our job well, changes to measures reflect variance in the underlying data distributions. Other times, we make mistakes. Either way, we are accountable to assist our stakeholders to understand the source of a change.
A screenshotted measure. "Why did this change?! It was 52% last Thursday"

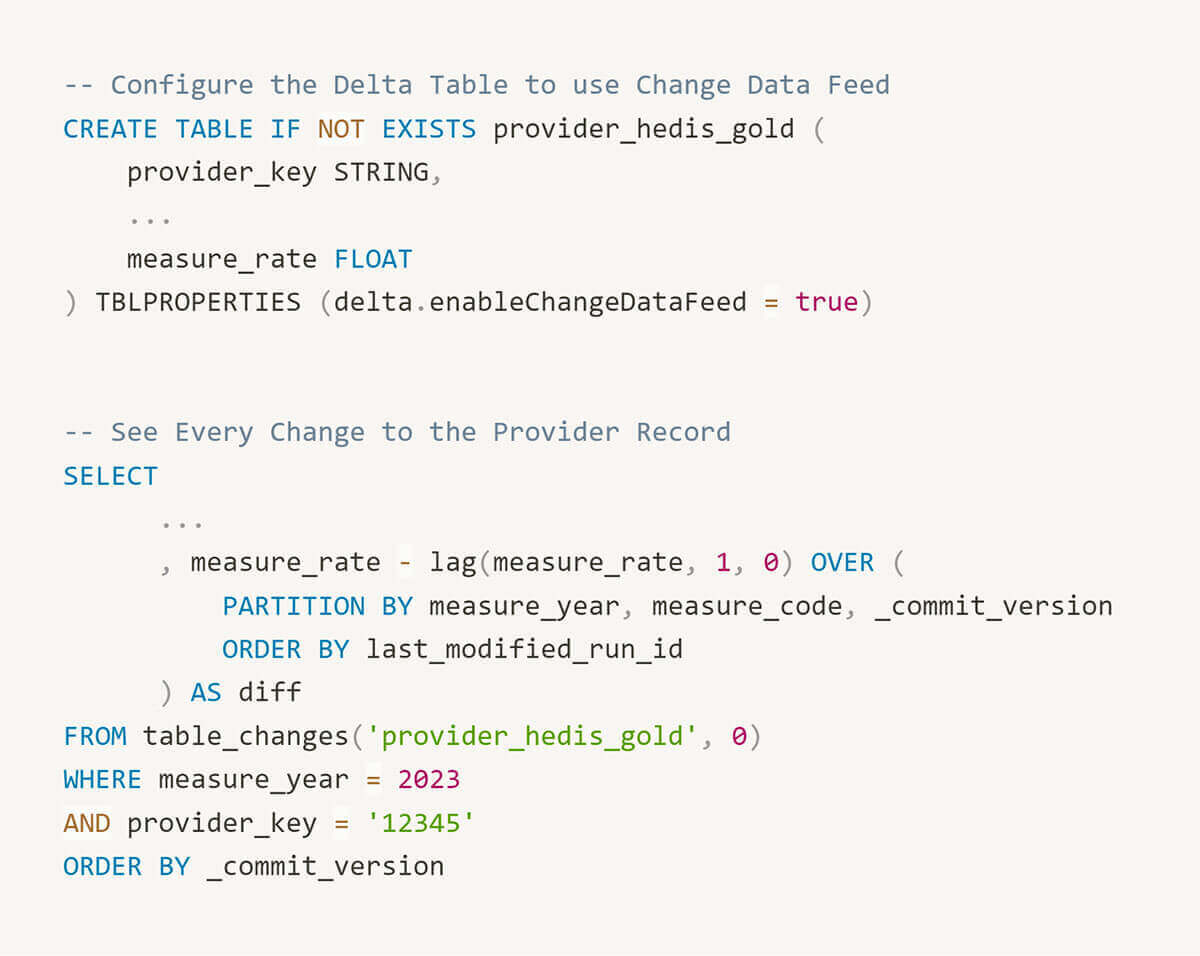
In the Databricks Delta Lake, the ability to revert datasets is a default. With a Delta Table, we can easily inspect a previous version of a member's record to debug an issue.

We have also enabled change data capture on smaller aggregate tables which tracks detail level changes. This capability allows us to easily reproduce and visualize how a rate is changing over time.

Reliable Pipelines with Standardized Formats
Our quality performance estimates are a key driver pushing us to develop a comprehensive patient data repository. Rather than learning of poorly controlled diabetes once a month via health plan reports, we prefer to ingest HL7 lab feeds daily. In the long term, setting up reliable data pipelines using raw, standardized data sources will facilitate broader use cases, e.g. custom quality measures and machine learning models trained on comprehensive patient records. As Micky Tripathi marches on and U.S. interoperability improves, we are cultivating the internal capacity to ingest raw data sources as they become available.
Enhanced Transparency
We coded the ApolloMed quality engine out to provide the actionable details we've always wanted as consumers of quality reports. Which lab met the numerator for this measure? Why was this member excluded from a denominator? This transparency helps report consumers understand the measures they're accountable to and facilitates gap closures.
Interested in learning more?
The ApolloMed quality engine has 20+ NCQA certified measures is now available to be deployed in your Databricks environment. To learn more, please review our Databricks solution accelerator or reach out to [email protected] for further details.
Never miss a Databricks post
What's next?

Healthcare & Life Sciences
November 14, 2024/2 min read
Providence Health: Scaling ML/AI Projects with Databricks Mosaic AI

Product
November 27, 2024/6 min read