What's new with Databricks SQL, February 2025
New features and performance improvements to make Databricks SQL simpler, faster, and more cost-efficient

Summary
- AI-powered migration to Databricks SQL is now accessible for Oracle, SQL Server, Snowflake, Redshift, and more.
- In the last 5-months alone, BI workloads are 14% faster, ETL jobs clock in 9% faster, and exploration workloads have improved by 13%.
- Databricks was named a Leader in the 2024 Gartner® Magic Quadrant™ for Cloud Database Management Systems for the fourth year in a row.
Databricks SQL continues to evolve with new features and performance improvements designed to make it simpler, faster, and more cost-efficient. Built on the lakehouse architecture within the Databricks Data Intelligence Platform, it’s trusted by over 11,000 customers to power their data workloads.
In this blog, we’ll cover key updates from the past three months, including our recognition in the 2024 Gartner® Magic Quadrant™ for Cloud Database Management Systems, enhancements in AI/BI, intelligent experiences, administration, and more.
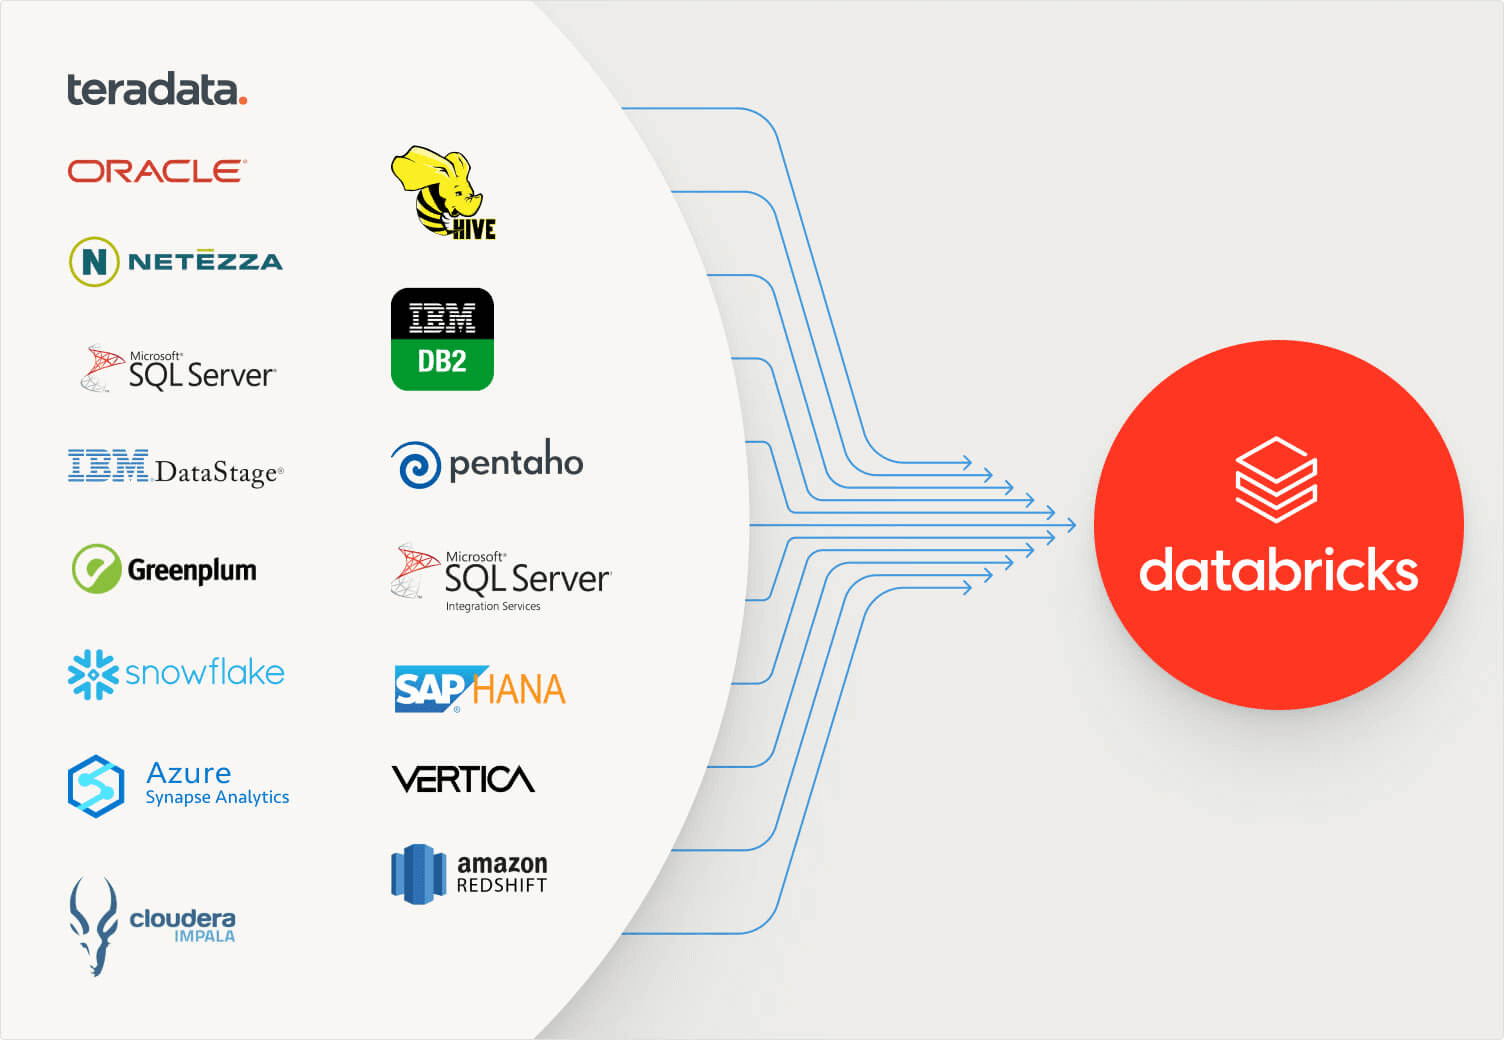
Accelerated data migrations with BladeBridge
Databricks welcomes BladeBridge, a proven provider of AI-powered migration solutions for enterprise data warehouses. Together, Databricks and BladeBridge will help enterprises accelerate the work required to migrate legacy data warehouses like Oracle, SQL Server, Snowflake, and Redshift to Databricks SQL (DBSQL), the data warehouse built on Databricks' category-defining lakehouse. BladeBridge will provide customers with clear insight into the scope of conversion, configurable code transpiling, LLM-powered conversion, and easy validation of migrated systems.
BladeBridge provides an AI-enhanced approach to migrate over 20 legacy data warehouses and ETL tools - including Teradata, Oracle, Snowflake, SQL Server, Amazon Redshift, Azure Synapse Analytics, and Hive - more than 50% faster than traditional approaches. To learn more, read the announcement blog.
Intelligent experiences
We’re focused on making the SQL analyst experience more intuitive, efficient, and engaging. By embedding AI throughout our products, you can spend less time on repetitive tasks and more time on high-value work.
AI/BI
Since the AI/BI launch in fall 2024, we’ve rolled out new features in Genie and Dashboards, with more on the way. Recent Dashboard updates include:
- improved AI assistance for generating charts
- copy-paste support for widgets across pages
- upgraded pivot tables and point maps for better data exploration
For Genie, we’ve enhanced:
- question benchmarking for more accurate evaluations
- editable, resizable visualizations for flexible reporting
- answer quality, with improvements in how it handles ranking results and managing date and time-related queries
Dive deeper into the new AI/BI updates.
SQL editor
We’re constantly improving the SQL authoring experience to help you work more efficiently. One of the biggest updates last quarter was Git support for queries, making it easier to version control your SQL and integrate with CI/CD pipelines.
*Git support for queries is available when the new SQL editor is enabled.
We’ve also added new features to streamline your workflow:
- Multiple result statements: View and compare outputs from different SQL statements side by side.
- Full result table filtering: Apply filters to entire datasets, not just the portion loaded in your browser.
- Faster tab switching: Up to 80% faster for loaded tabs and 62% faster for unloaded tabs, making navigation smoother.
- Adjustable font size: You can quickly change the SQL editor font size with keyboard shortcuts (Alt + / Alt—on Windows/Linux, Opt + / Opt—on macOS).
- Improved comments with @mentions: Collaborate in real-time by mentioning teammates directly in comments using “@” followed by their username. They’ll receive email notifications, keeping everyone in the loop.
Predictive optimization of your platform
Predictive optimizations use AI to automatically manage performance for all of your workloads. We are constantly improving and adding features in this area to eliminate the need for manual tuning across the platform.
Predictive optimization for statistics
The data lakehouse utilizes two distinct types of statistics: data-skipping statistics (also known as Delta stats) and query optimizer statistics. Data-skipping statistics are collected automatically, but as data grows and usage diversifies, determining when to run the ANALYZE command becomes complex. You also have to maintain your query optimizer statistics actively.
We are excited to introduce the gated Public Preview of Predictive Optimization for statistics. Predictive Optimization is now generally available as an AI-driven approach to streamlining optimization processes. This feature currently supports essential data layout and cleanup tasks, and early feedback from users highlights its effectiveness in simplifying routine data maintenance. With the addition of automatic statistics management, Predictive Optimization delivers value and simplifies operations through the following advancements:
- Intelligent selection of data-skipping statistics, eliminating the need for column order management
- Automatic collection of query optimization statistics, removing the necessity to run ANALYZE after data loading
- Once collected, statistics inform query execution strategies and, on average, drive better performance and lower costs
Utilizing up-to-date statistics significantly enhances performance and total cost of ownership (TCO). Comparative analysis of query execution with and without statistics revealed an average performance increase of 22% across observed workloads. Databricks applies these statistics to refine data scanning processes and select the most efficient query execution plan. This approach exemplifies the capabilities of the Data Intelligence Platform in delivering tangible value to users.
To learn more, read this blog.
World-class price/performance
The query engine continues to be optimized to scale compute costs with near linearity to data volume. Our goal is ever-better performance in a world of ever-increasing concurrency–with ever-decreasing latency.
Improved performance across the board
Databricks SQL has seen a remarkable 77% performance improvement since its launch in 2022, delivering faster BI queries, more responsive dashboards, and quicker data exploration. In the last 5-months of the year alone, BI workloads are 14% faster, ETL jobs clock in 9% faster, and exploration workloads have improved by 13%. On top of that, we rolled out enhanced concurrency features and advanced compression in Private Preview, ensuring you save on both time and cost.
Databricks named a leader in 2024 Gartner® Magic Quadrant™ for Cloud Database Management Systems
For the fourth year in a row, Databricks has been named a Leader in the 2024 Gartner® Magic Quadrant™ for Cloud Database Management Systems. This year, we’ve made gains in both the Ability to Execute and the Completeness of our Vision. The evaluation covered the Databricks Data Intelligence Platform across AWS, Google Cloud, and Azure, alongside 19 other vendors.
Administration and management
We are expanding capabilities to help workspace administrators configure and manage SQL warehouses, including system tables and a new chart to troubleshoot warehouse performance.
Cost management
To give you visibility into how your organization is using Databricks, you can use the billing and cost data in your system tables. To make that easier, we now have a pre-built AI/BI Cost Dashboard. The dashboard organizes your consumption data using best practices for tagging, and helps you create budgets to manage your spend at an organization, business unit or project level. You can then set budget alerts when you exceed the budget (and track down which project / workload / user overspent).
For more information, check out this cost management blog.
System tables
We recommend system tables to observe essential details about your Databricks account, including cost information, data access, workload performance, etc. Specifically, they are Databricks-owned tables you can access from various surfaces, usually with low latency.
Warehouses
The Warehouses system table (system.compute.warehouses table) records when SQL warehouses are created, edited, and deleted. You can use the table to monitor changes to warehouse settings, including the warehouse name, type, size, channel, tags, auto-stop, and autoscaling settings. Each row is a snapshot of a SQL warehouse’s properties at a specific point in time. A new snapshot is created when the properties change. For more details, see Warehouses system table reference. This feature is in Public Preview.
Query history
The Query history table (system. query.history) includes records for queries run using SQL warehouses or serverless compute for notebooks and jobs. The table consists of account-wide records from all workspaces in the same region from which you access the table. This feature is in Public Preview.
For more details, see the Query history system table reference.
Completed query count chart to help troubleshoot warehouse performance
A Completed query count chart (Public Preview) is now available on the SQL warehouse monitoring UI. This new chart shows the number of queries finished in a time window. The chart can be used alongside the peak running queries and running clusters chart to visualize changes to warehouse throughput as clusters spin up or down depending on your workload traffic and warehouse settings. For more information, see Monitor a SQL warehouse.
Expanded regions and compliance availability for Databricks SQL Serverless
Availability and compliance are extended for Databricks SQL Serverless warehouses.
- New Serverless regions:
- GCP is now generally available across the existing seven regions.
- AWS adds the eu-west-2 region for London.
- Azure adds four regions: France Central, Sweden Central, Germany West Central, and UAE North.
- Serverless compliance by region
- HIPAA: HIPAA compliance is available in all regions where Serverless SQL is available across all cloud providers (Azure, AWS, and GCP).
- AWS US-East-1: PCI-DSS, FedRamp Mod compliance now GA
- AWS AP-Southeast-2: PCI-DSS and IRAP compliance now GA
- Serverless Security
- Private Link: Private link helps you use a private network from your users to your data and back again. It is now generally available.
- Secure Egress helps safely control outbound data access, ensuring security and compliance. Configure egress controls is now available in Public Preview.
Integration with Data Intelligence Platform
These features for Databricks SQL are part of the Databricks Data Intelligence Platform. Databricks SQL benefits from the platform's capabilities of simplicity, unified governance, and openness of the lakehouse architecture. The following are a few new platform features beneficial for Databricks SQL.
SQL language enhancements: Collations
Building global enterprise applications means handling diverse languages and inconsistent data entry. Collations streamline data processing by defining rules for sorting and comparing text in ways that respect language and case sensitivity. Collations make databases language- and context-aware, ensuring they handle text as users expect.
We are excited that collations are now available in Public Preview with Databricks SQL. Read the collations blog for more details.
Materialized views and streaming tables
Materialized views (MVs) and streaming tables (STs) are now Generally Available in Databricks SQL on AWS, Azure, and GCP. Streaming tables offer simple, incremental ingestion from sources like cloud storage and message buses with just a few lines of SQL. Materialized views precompute and incrementally update the results of queries so your dashboards and queries can run significantly faster than before. Together, they allow you to create efficient and scalable data pipelines using SQL, from ingestion to transformation.
For more details, read the MV and ST announcement blog.
Easier scheduling for Databricks SQL streaming tables and materialized views
We’ve introduced EVERY syntax for scheduling MV and ST refreshes using DDL. EVERY simplifies time-based scheduling by removing the need to write complex CRON expressions. For users who need more flexibility, CRON scheduling will continue to be supported.
For more details, read the documentation for ALTER MATERIALIZED VIEW, ALTER STREAMING TABLE, CREATE MATERIALIZED VIEW, and CREATE STREAMING TABLE.
Streaming tables support for time travel queries
You can now use time travel to query previous streaming table versions based on timestamps or table versions (as recorded in the transaction log). You may need to refresh your streaming table before using time travel queries.
Time travel queries are not supported for materialized views.
Query history support for Delta Live Tables
Query History and Query Profile now cover queries executed through a DLT pipeline. Moreover, query insights for Databricks SQL materialized views (MVs) and streaming tables (STs) have been improved. These queries can be accessed from the Query History page alongside queries executed on SQL Warehouses and Serverless Compute. They are also listed in the context of the Pipeline UI, Notebooks, and the SQL editor.
This feature is available in Public Preview. For more details, see Access query history for Delta Live Table pipelines.
Cross-platform view sharing for Azure Databricks
Databricks recipients can now query shared views using any Databricks compute resource. Previously, if a recipient’s Azure Databricks account differed from the provider’s, recipients could only query a shared view using a serverless SQL warehouse. See Read shared views.
View sharing also now extends to open-sharing connectors. See Read data shared using Delta Sharing open sharing (for recipients).
This capability is now in Public Preview.
More details on new innovations
We hope you enjoy this bounty of innovations in Databricks SQL. You can always check this What’s New post for the previous three months. Below is a complete inventory of launches we've blogged about over the last quarter:
- February 2025: What's new with AI/BI -- Feb '25
- February 2025: Welcoming BladeBridge to Databricks: Accelerating Data Warehouse Migrations to the Lakehouse
- January 2025: Easy ways to optimize your costs
- January 2025: Introducing Collations to Databricks
- December 2024: Databricks named a leader in the 2024 Gartner Magic Quadrant for Cloud Database Management System
- December 2024: Step-by-step guide to AI-powered customer sentiment analysis
- November 2024: Introducing Predictive Optimization Statistics
- November 2024: What's new in AI/BI Dashboards - Fall '24
As always, we continue to work to bring you even more cool features. Stay tuned to the quarterly roadmap webinars to learn what's on the horizon for Data Warehousing and AI/BI. It's an exciting time to be working with data, and we're excited to partner with Data Architects, Analysts, BI Analysts, and more to democratize data and AI within your organizations!
What’s next
Here is a short preview of the features we are working on. None of these have committed timeframes yet, so don’t ask. :-)
Easily migrate your data warehouse to Databricks SQL
Customers of every size can significantly reduce cost and lower risk when modernizing their data infrastructure away from proprietary, expensive, and siloed platforms that have defined the history of data warehousing. We are working on expanding free tooling to help you analyze what it would take to migrate from your current warehouse to Databricks SQL and help you convert your code to take advantage of new Databricks SQL features.
Supercharge your BI workloads
Performance is critical when loading business intelligence dashboards. We are improving the the latency of BI queries every quarter so you can power up your favorite BI tools like Power BI, Tableau, Looker and Sigma with Databricks SQL.
Simplify managing and monitoring warehouses
We are investing in more features and tools to help you easily manage and monitor your warehouse. This includes system table enhancements, changes via the UI, and our APIs.
To learn more about Databricks SQL, visit our website or read the documentation. You can also check out the product tour for Databricks SQL. Suppose you want to migrate your existing warehouse to a high-performance, serverless data warehouse with a great user experience and lower total cost. In that case, Databricks SQL is the solution — try it for free.
To participate in private or gated public previews, contact your Databricks account team.
Never miss a Databricks post
What's next?


Product
November 21, 2024/3 min read