Introducing R Notebooks in Databricks

Apache Spark 1.4 was released on June 11 and one of the exciting new features was SparkR. I am happy to announce that we now support R notebooks and SparkR in Databricks, our hosted Spark service. Databricks lets you easily use SparkR in an interactive notebook environment or standalone jobs.
R and Spark nicely complement each other for several important use cases in statistics and data science. Databricks R Notebooks include the SparkR package by default so that data scientists can effortlessly benefit from the power of Apache Spark in their R analyses. In addition to SparkR, any R package can be easily installed into the notebook. In this blog post, I will highlight a few of the features in our R Notebooks.
Getting Started with SparkR
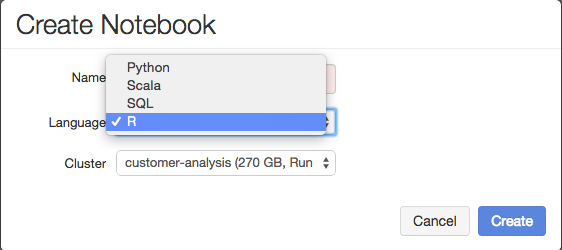
To get started with R in Databricks, simply choose R as the language when creating a notebook. Since SparkR is a recent addition to Spark, remember to attach the R notebook to any cluster running Spark version 1.4 or later. The SparkR package is imported and configured by default. You can run Spark queries in R:
Using SparkR you can access and manipulate very large data sets (e.g., terabytes of data) from distributed storage (e.g., Amazon S3) or data warehouses (e.g., Hive).
Autocomplete and Libraries
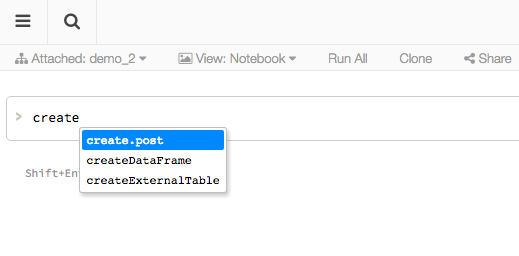 Databricks R notebooks offer autocomplete similar to the R shell. Pressing TAB will complete the code or present available options if multiple exist. You can install any R library in your notebooks using
 install.packages(). Once you import the new library, autocomplete will also apply to the newly introduced methods and objects.
Interactive Visualization
At Databricks we believe visualization is a critical part of data analysis. As a result we embraced R’s powerful visualization and complemented it with many additional visualization features.
Inline plots
In R Notebooks you can use any R visualization library, including base plotting, ggplot, Lattice, or any other plotting library. Plots are displayed inline in the notebook and can be conveniently resized with the mouse.
One-click visualizations
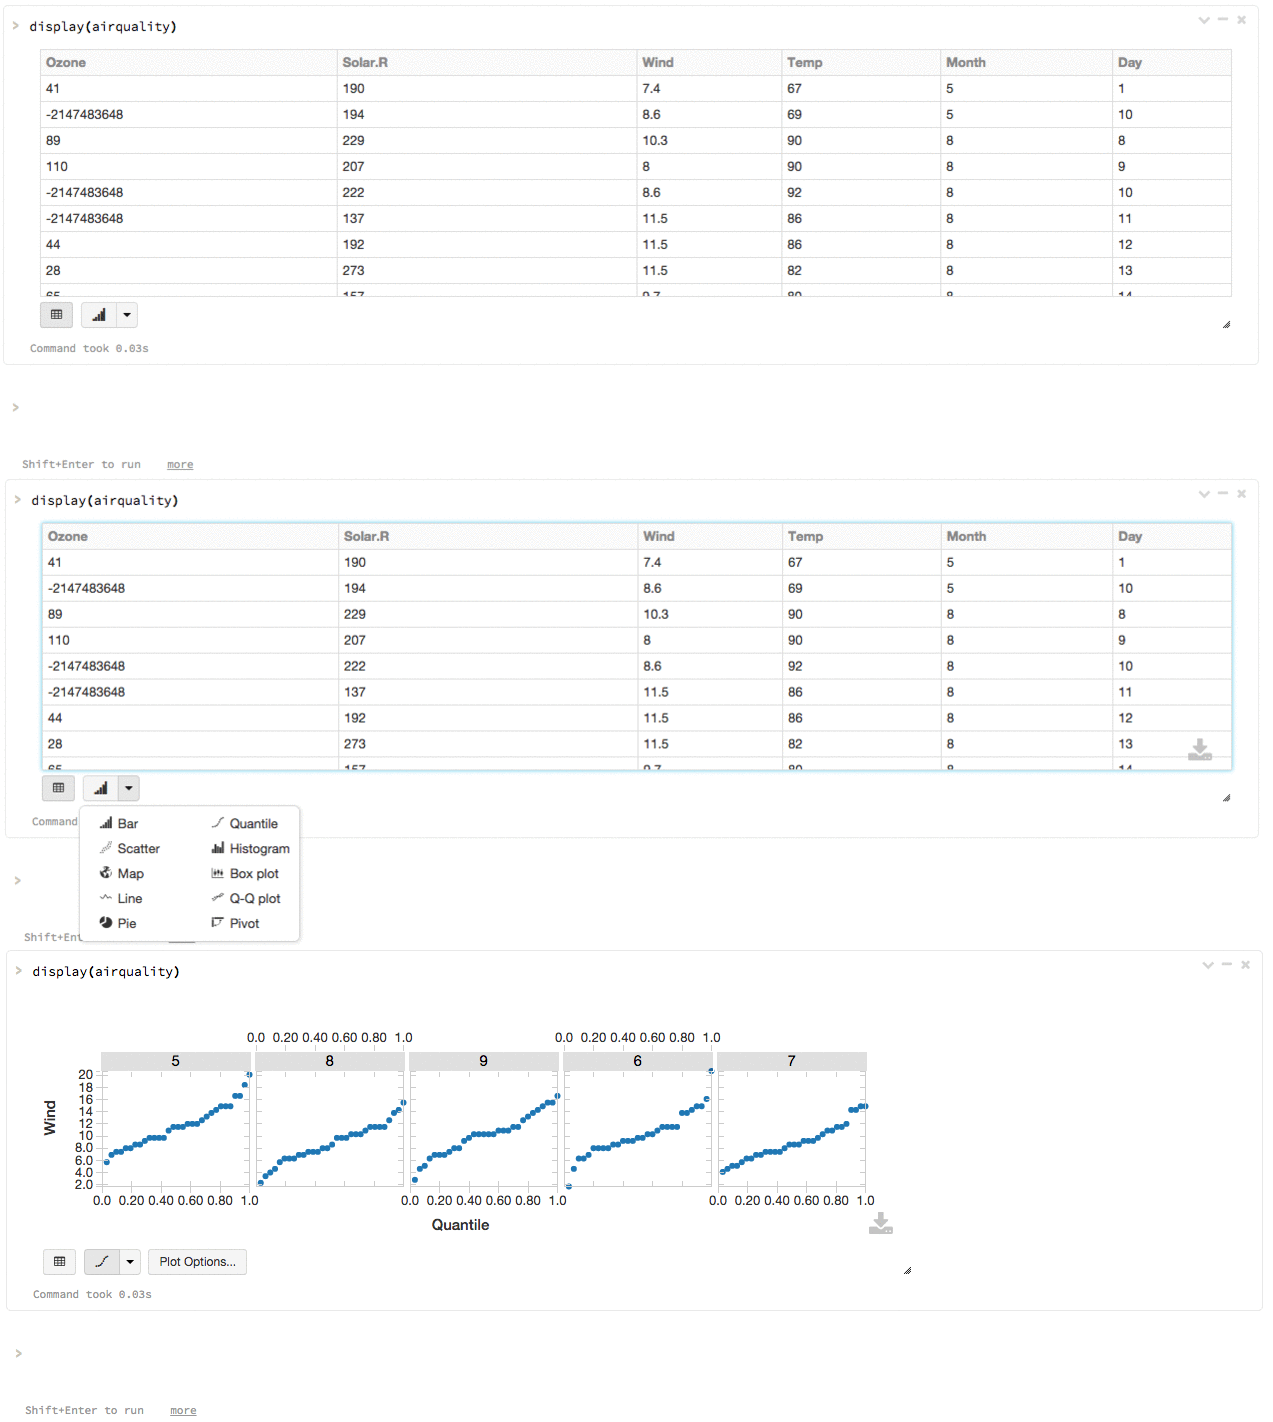
You can use Databricks’s built-in display() function on any R or SparkR DataFrame. The result will be rendered as a table in the notebook, which you can then plot with one click without writing any custom code.
Advanced interactive visualizations
Similar to other Databricks notebooks, you can use displayHTML() function in R notebooks to render any HTML and Javascript visualization.
Running Production Jobs
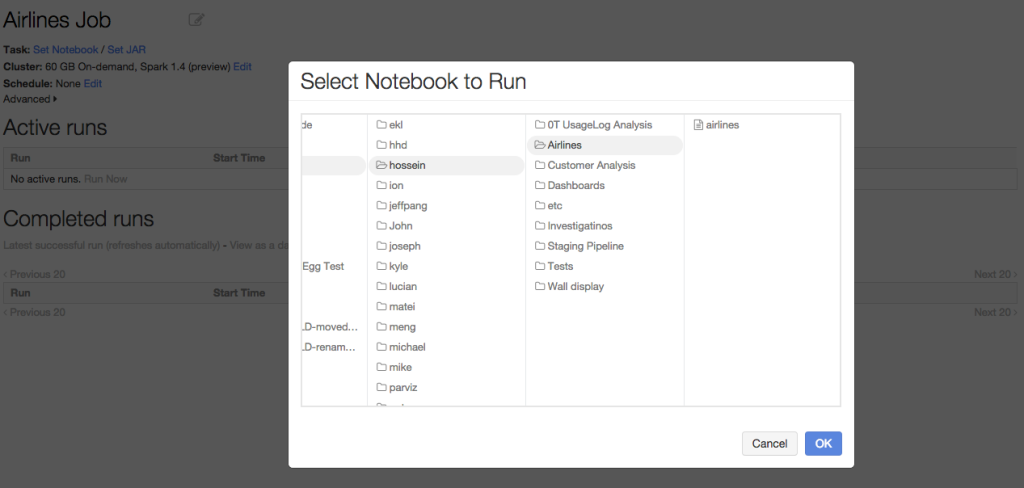
Databricks is an end-to-end solution to make building a data pipeline easier - from ingest to production. The same concept applies to R Notebooks as well: You can schedule your R notebooks to run as jobs on existing or new Spark clusters. The results of each job run, including visualizations, are available to browse, making it much simpler and faster to turn the work of data scientists into production.
Summary
R Notebooks in Databricks let anyone familiar with R take advantage of the power of Spark through simple Spark cluster management, rich one-click visualizations, and instant deployment to production jobs. We believe SparkR and R Notebooks will bring even more people to the rapidly growing Spark community.
To try out the powerful R Notebooks for yourself, sign-up for a 14-day free trial of Databricks today!
Never miss a Databricks post
What's next?

Product
November 21, 2024/3 min read
How to present and share your Notebook insights in AI/BI Dashboards

Product
December 10, 2024/7 min read
