Introducing Databricks Dashboards
by Dave Wang
Today we are excited to announce an expansion to our platform, a new capability called "Databricks Dashboards" (Dashboards). In a nutshell, a Dashboard is a visual report backed by Apache Spark clusters, where users can consume information visually, or even interactively run queries by changing parameters. It is a simple way for users to instantly consume the insights generated by Spark. Databricks is the first company to make Spark widely useful in this way.
The Power of Spark, from Data Scientists to Business Users
For data scientists (or anyone who analyzes data) creating tangible impact requires more than just finding the right answers - they also have to communicate the answers to the relevant decision makers just-in-time. Typically, the process of publishing these hard-earned insights requires third-party integrations with the data processing platform, resulting in many handoffs, delays, and tedious work.
Our goal in building Dashboards is to bring Spark's greater impact to the enterprise, by streamlining the entire data-driven decision-making process - from data crunching to publishing insights. We've already built capabilities, such as the notebook environment and the Spark cluster manager, that enable technical users to easily utilize Spark for data processing and analysis. The addition of Dashboards will make the insights generated from Spark instantly accessible to all users in the enterprise so that the entire organization can benefit from the power of Spark.
Dashboards: One Notebook, Multiple Views
Dashboards can be created directly from Databricks notebooks with a single click. In fact, a Dashboard is just another view of a notebook. Users can instantly create many different dashboards from one notebook, tailoring the presentation of the same results to different audiences.
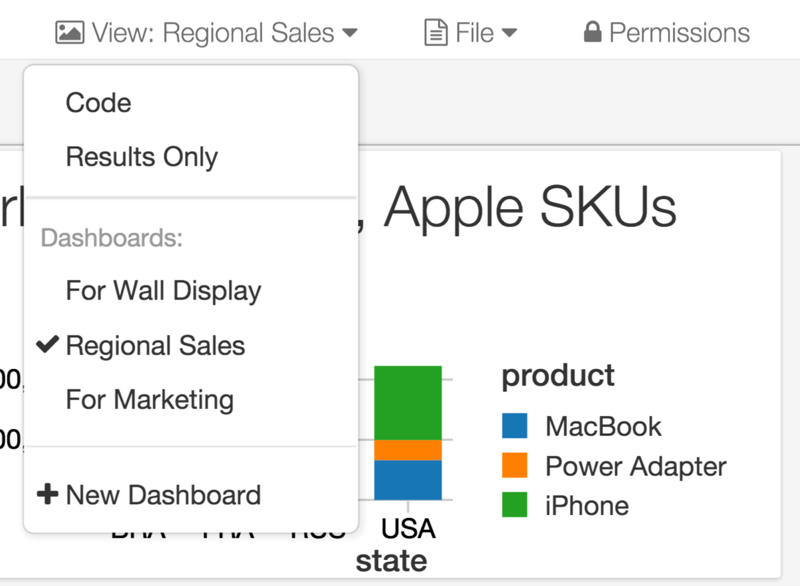
Dashboards are customizable to present results in the notebook in a wide variety of visual formats. The interface allows users to customize the look and feel in a simple point-and-click fashion.
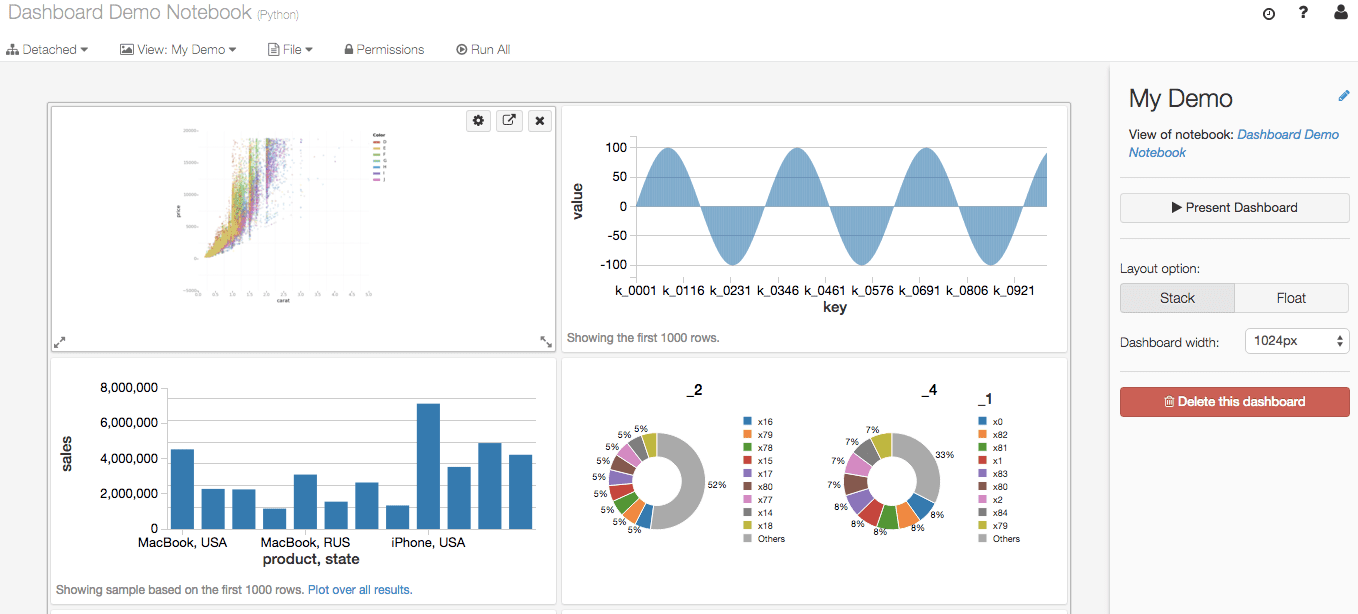
Once a dashboard has been built, it could be hosted on the Databricks platform and broadly shared via its URL. The security controls that we released last year allow users to precisely manage who has access to view the Dashboard and who has the right to edit.
Opening Up Spark to All with Interactive Queries
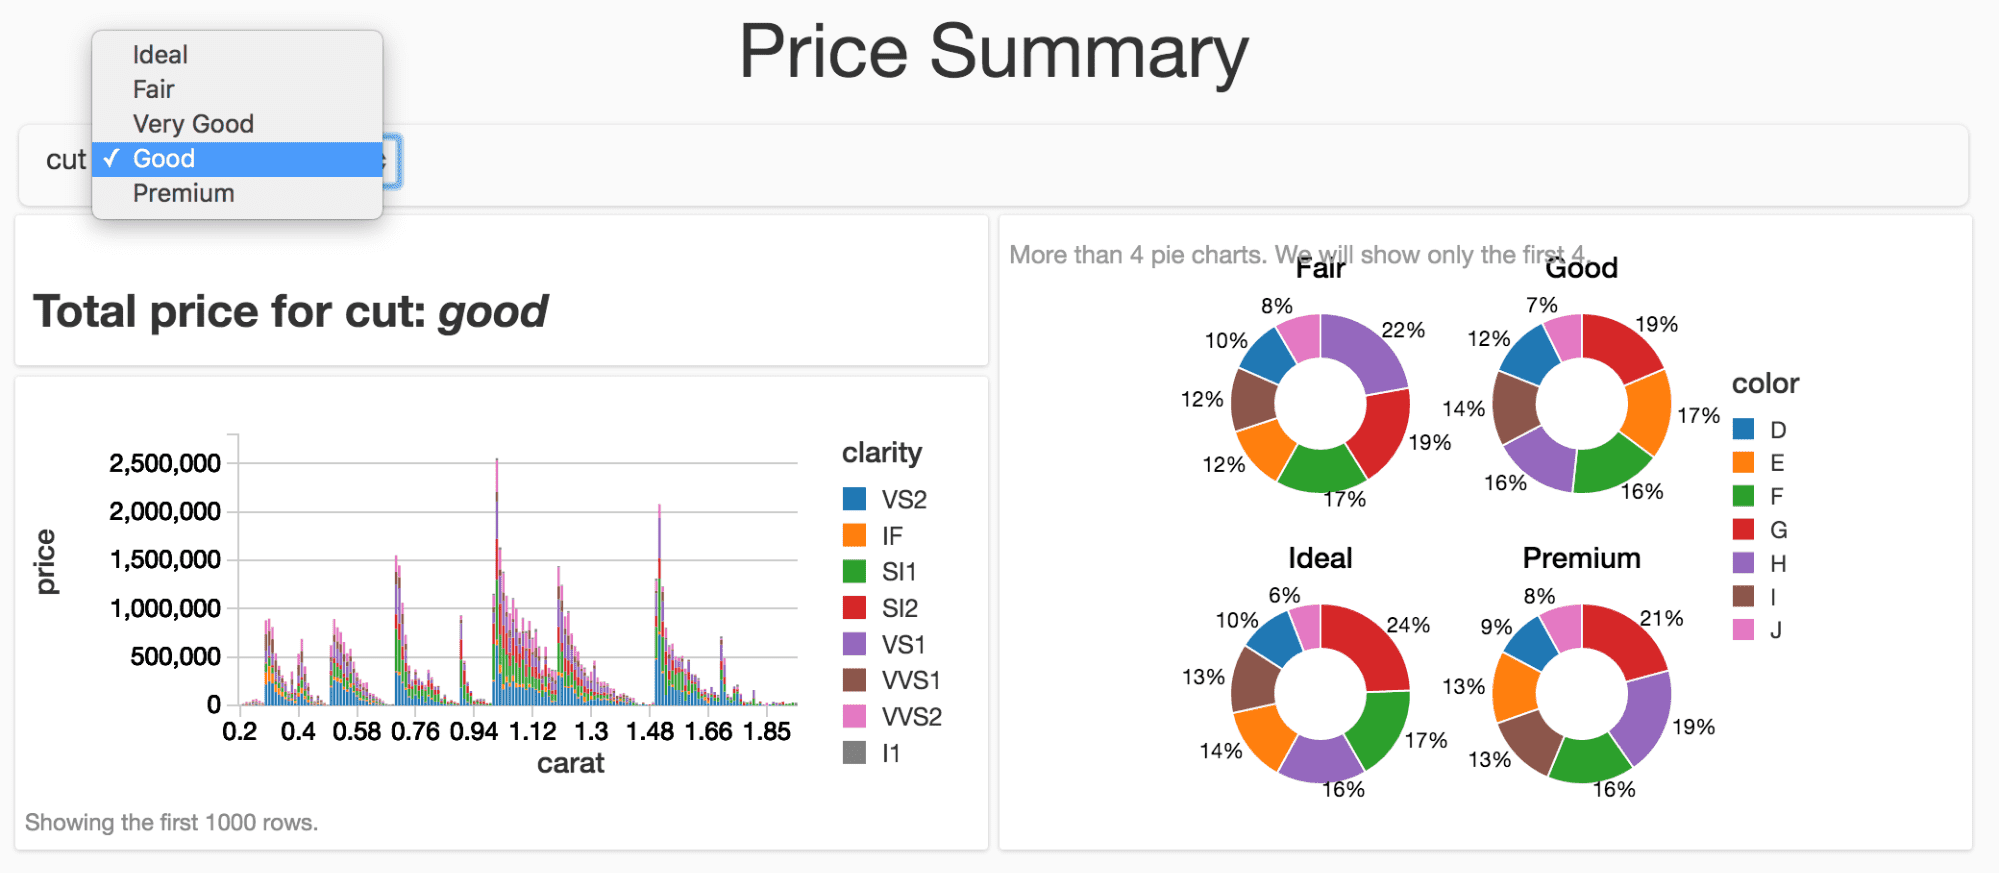
It is easy to build Dashboards with drop-down menus that allow viewers to input different parameters to the underlying logic. Since Dashboards are another view of notebooks, this mechanism is a simple way for anyone in the organization to harness the power of notebooks for computation in a controlled manner. This approach does not require the users to have Spark knowledge, and it eliminates the risk of accidental changes to critical code. Having drop-down menus enables a common use case where Databricks users can build Dashboards to enable others to perform scenario analysis efficiently.
Monitoring Critical Operations with Dashboards
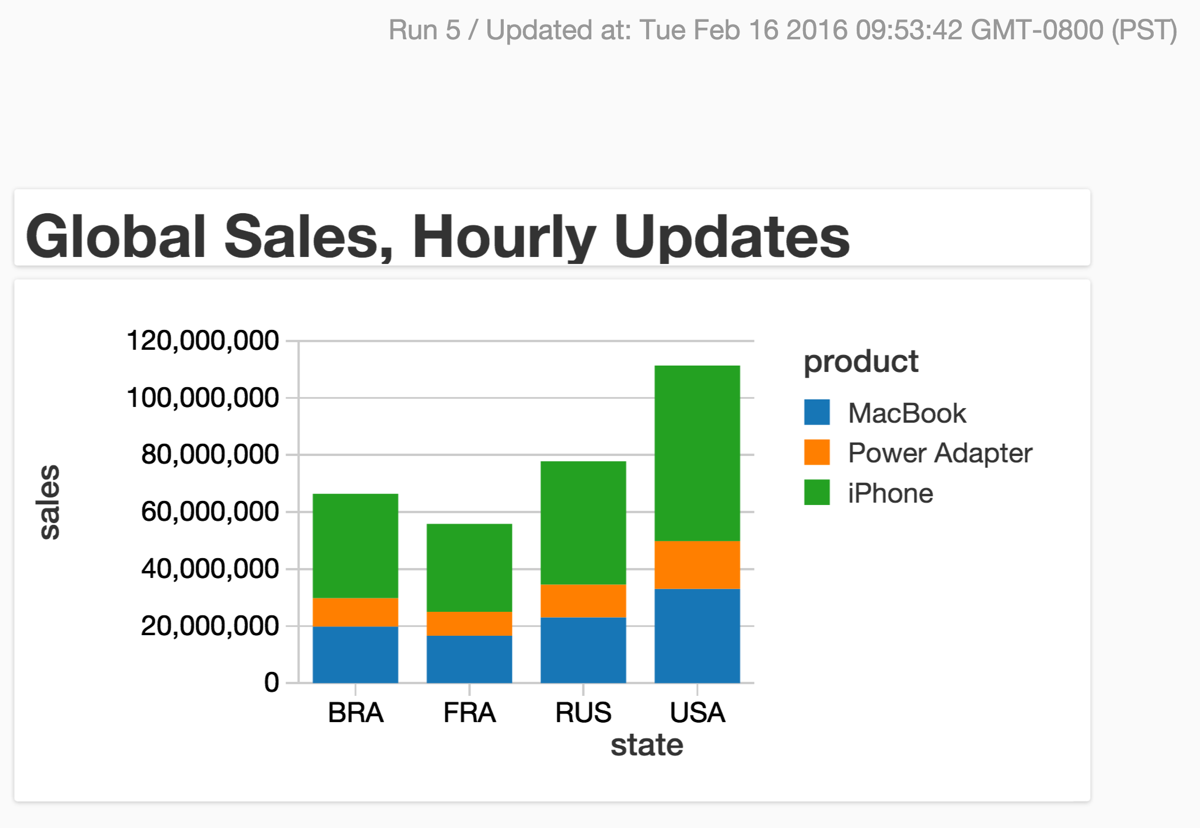
Databricks already provides an easy and robust way to create Spark jobs. With the addition of the Dashboards capability, Databricks Jobs can be configured to update Dashboards continuously with a few clicks. This combination allows users to build a dynamic Dashboard that automatically updates itself to monitor critical operations without complex DevOps or third party integrations.
Take Dashboards for a Test Drive Today
Dashboards is available immediately. Now everyone can benefit from the power of Spark by instantly accessing the insights derived from Spark and utilize them to make business-critical decisions just-in-time, without complex tools or processes. This enables enterprises to make real-time decisions with a single platform that can process data as well as seamlessly publish results.
To try out the Databricks Dashboards today, sign-up for a 14-day trial or contact us.
Get the latest posts in your inbox
Subscribe to our blog and get the latest posts delivered to your inbox.