Apache Spark Cluster Monitoring with Databricks and Datadog
Monitor your Databricks clusters with Datadog in a few easy steps
by Caryl Yuhas and Ilan Rabinovitch
This blog post is a joint effort between Caryl Yuhas, Databricks’ Solutions Architect, and Ilan Rabinovitch, Datadog’s Director of Technical Community and Evangelism.
UPDATED: Jun 12, 2018
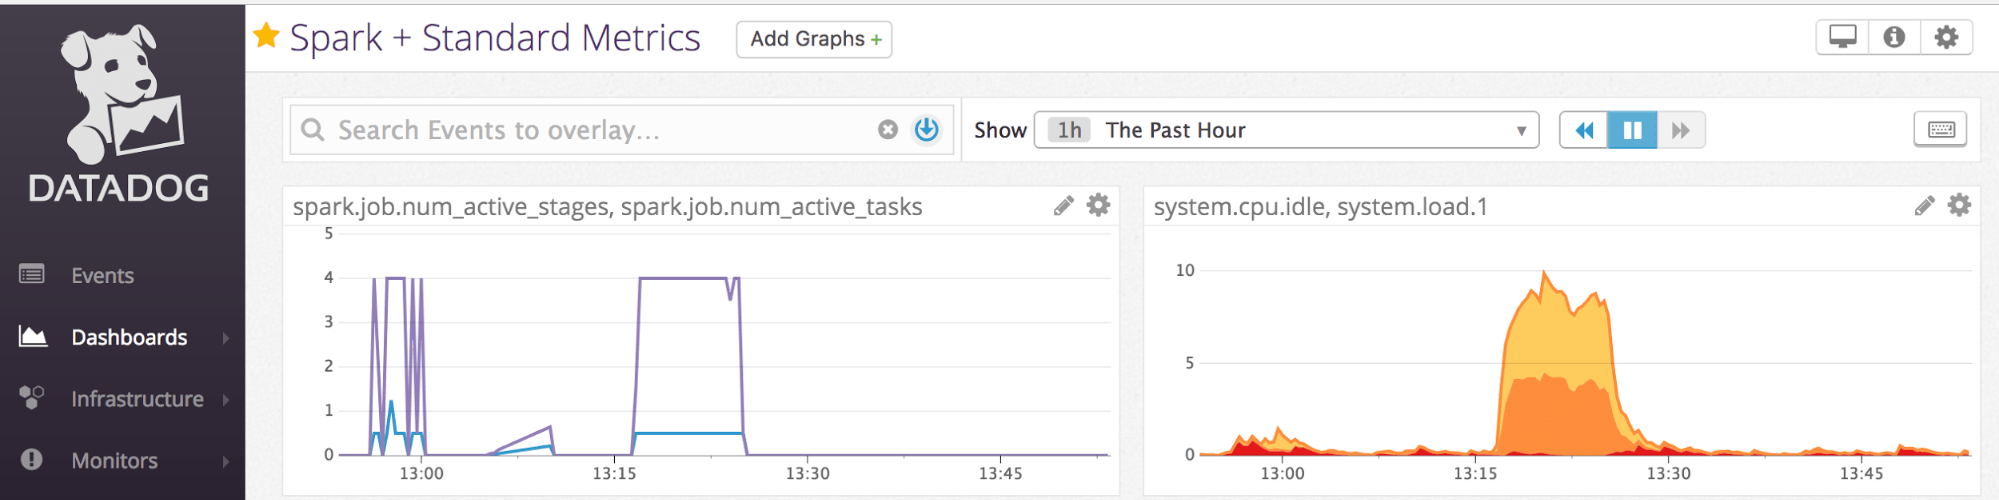
Monitoring the health of any large Apache Spark cluster is an imperative necessity among engineers. They want visibility into clusters’ internals; they want system metrics from individual nodes’ CPU, disk usage, and Spark metrics across each active stage or cached partition.
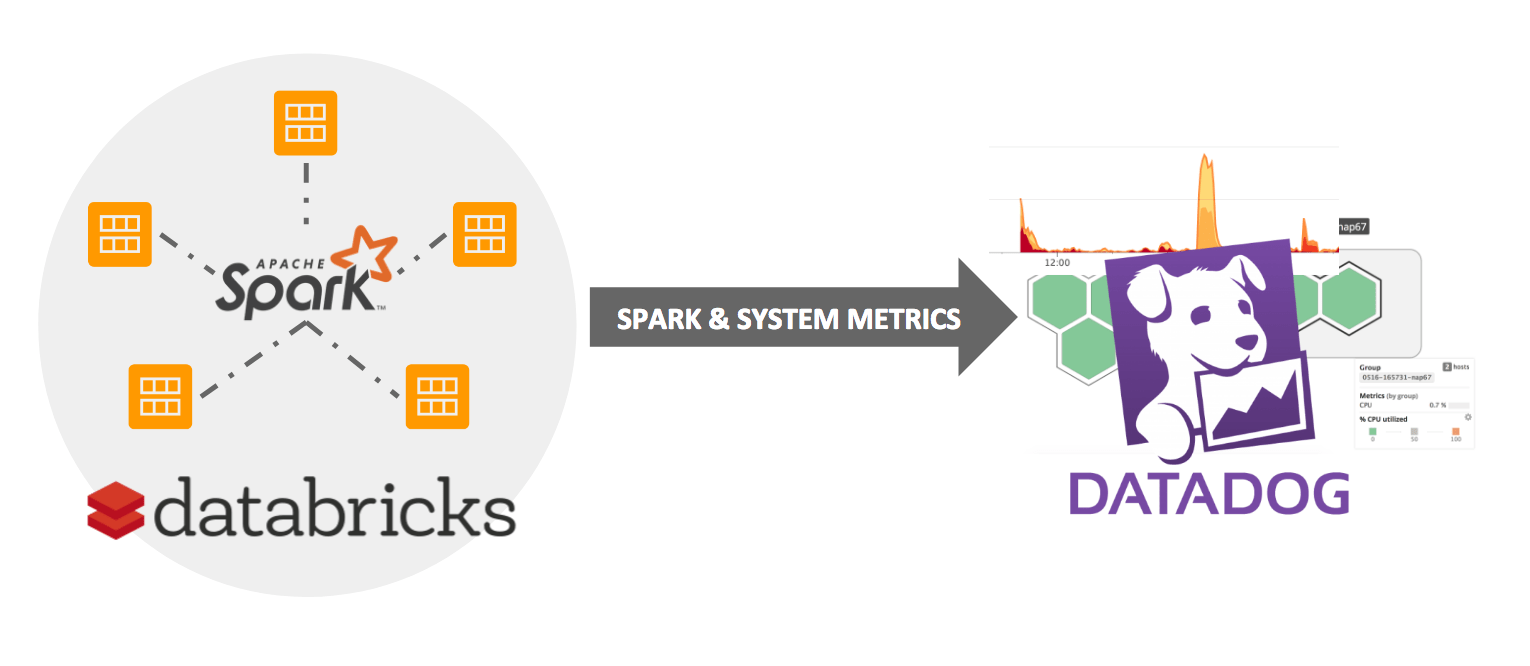
Datadog as a SaaS-based monitoring and analytics platform affords engineers all the monitoring capabilities they desire. And in this blog, we’ll show how easy it is to use Datadog to monitor the system and garner Spark metrics from Databricks' Spark clusters.
We will walk through two ways to set up Datadog monitoring in Databricks:
- Automated Datadog Monitoring: [Import Notebook] A one-click way to automate Datadog monitoring for all of your Databricks nodes and clusters. With just one command, you can configure Databricks to start a Datadog agent and stream both system and Spark metrics to your Datadog dashboard every time you launch a cluster.
-
Datadog Setup Walkthrough: [Import Notebook] A step-by-step process for installing the Datadog agent on an existing Databricks cluster to start collecting Spark-specific metrics. You can follow along and import the notebook if you want to test this integration on one of your own clusters.
Automated Datadog Monitoring
If you’re looking for a way to set up monitoring for your Databricks’ clusters as quickly as possible, our Datadog Init Scripts are a great option. When you import and run the first notebook above, it will create one init script that automatically installs a Datadog agent on every machine you spin up in Databricks, and one init script that configures each cluster to send Spark metrics. To use this script, all you need to do is:
- Enter your own Datadog API key in the DD_API_KEY parameter (Line 4).
- Run the notebook once to save the init script as a global configuration.
That’s all there is to it! Once you run the notebook, each new cluster will begin streaming metrics directly to your dashboards in Datadog.
What Exactly Is the init Script Doing?
The first script, datadogInstall.sh, simply creates an agent on every machine in your cluster according to the Datadog installation instructions (see Step 1 in the Datadog Setup Walkthrough section below).
The second script configures your cluster to report Spark-specific metrics back to Datadog. For more detail on this configuration, read the next section.
Datadog Setup Walkthrough
Now let’s walk through the setup step by step. This can be used to set up a Datadog agent on an existing cluster.
- One-line Install. Datadog makes it very simple — a one-line curl command, to be exact — to install an agent on your system. In this case, we’ll use the Ubuntu package install:
You’ll find the latest version of this command in your Datadog Setup Guide.
Note: Make sure you check the Datadog site for the latest install command and use the API key specified in your account.
- Configure for Spark. In order to start monitoring the Spark metrics on a cluster, a Spark config file must be written into the driver of the cluster. This config file requires the hostname and port of the driver so that the Datadog agent can point to it and listen for the Spark metrics. The hostname and port can be found in the master-params file as follows:
These gets entered into the spark_url parameter of the config as shown below:
- Restart Agent. Once this config file is updated, the agent simply needs to be restarted in order to complete the Spark integration.
- Check Connection. A successful connection can be confirmed by calling the Datadog info command and looking for the following Spark check:
Conclusion
While this post provides a detailed tutorial and setup script for Datadog, Databricks also provides users with the flexibility to connect to clusters and machines from other services. In particular, init scripts allow you to execute shell scripts on both the drivers and workers. In general, the init scripts from the post above can be adapted and customized to install and connect your monitoring agent of choice.
Try the notebooks on Datadog and Databricks today.
Get the latest posts in your inbox
Subscribe to our blog and get the latest posts delivered to your inbox.