Productionizing Machine Learning: From Deployment to Drift Detection
by Joel Thomas and Clemens Mewald
Try this notebook to reproduce the steps outlined below and watch our on-demand webinar to learn more.
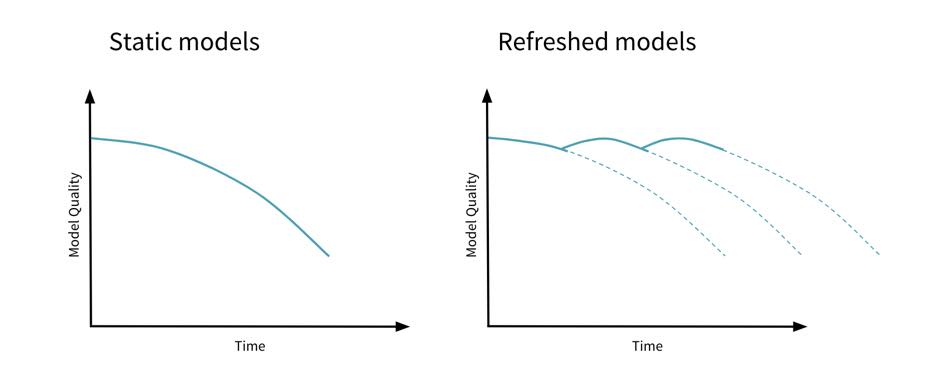
In many articles and blogs the machine learning workflow starts with data prep and ends with deploying a model to production. But in reality, that's just the beginning of the lifecycle of a machine learning model. As they say, “Change is the only constant in life”. This also holds true for machine learning models, as over time they could deteriorate in their accuracy or in their predictive power, often referred to as model drift. This blog discusses how to detect and address model drift.
Types of Drift in Machine Learning
Model drift can occur when there is some form of change to feature data or target dependencies. We can broadly classify these changes into the following three categories: concept drift, data drift, and upstream data changes.
Concept Drift
When statistical properties of the target variable change, the very concept of what you are trying to predict changes as well. For example, the definition of what is considered a fraudulent transaction could change over time as new ways are developed to conduct such illegal transactions. This type of change will result in concept drift.
Data Drift
The features used to train a model are selected from the input data. When statistical properties of this input data change, it will have a downstream impact on the model’s quality. For example, data changes due to seasonality, personal preference changes, trends, etc. will lead to incoming data drift.
Upstream Data Changes
Sometimes there can be operational changes in the data pipeline upstream which could have an impact on the model quality. For example, changes to feature encoding such as switching from Fahrenheit to Celsius and features that are no longer being generated leading to null or missing values, etc.
Ways to detect and protect against Model Drift
Given that there will be such changes after a model is deployed to production, your best course of action is to monitor for changes and take action when changes occur. Having a feedback loop from a monitoring system, and refreshing models over time, will help avoid model staleness.

As we saw above, drift could happen from various sources and hence you should monitor all these sources to ensure full coverage. Here are a few scenarios where you can deploy monitoring:
Training data
- Schema & distribution of incoming data
- Distribution of labels
Requests & predictions
- Schema & distribution of requests
- Distribution of predictions
- Quality of predictions
Managing Model Drift at Scale Using Databricks
Detecting Data Drift with Delta Lake
Data quality is the first line of defense against poor model quality and model drift. Delta Lake helps to ensure a data pipeline is built with high quality and reliability by providing features such as schema enforcement, data type, and quality expectations. Typically you can fix data quality or correctness issues by updating the incoming data pipeline, such as fixing or evolving the schema and cleaning up erroneous labels, etc.
Detecting Concept and Model Drift with Databricks Runtime for ML and MLflow
A common way to detect model drift is to monitor the quality of predictions. An ideal ML model training exercise would start with loading data from sources such as Delta Lake tables, followed by feature engineering, model tuning and selection using Databricks Runtime for ML, while having all experiment runs and produced models tracked in MLflow.
In the deployment phase, models are loaded from MLflow at runtime to make predictions. You can log model performance metrics as well as predictions back to storage such as Delta Lake for use in downstream systems and performance monitoring. By having training data, performance metrics, and predictions logged in one place you can ensure accurate monitoring.
During supervised training, you use features and labels from your training data to evaluate the quality of the model. Once a model is deployed, you can log and monitor two types of data: model performance metrics and model quality metrics.
- Model performance metrics refer to technical aspects of the model, such as inference latency or memory footprint. These metrics can be logged and monitored easily when a model is deployed on Databricks.
- Model quality metrics depend on the actual labels. Once the labels are logged, you can compare predicted and actual labels to compute quality metrics and detect drift in the predictive quality of the model.

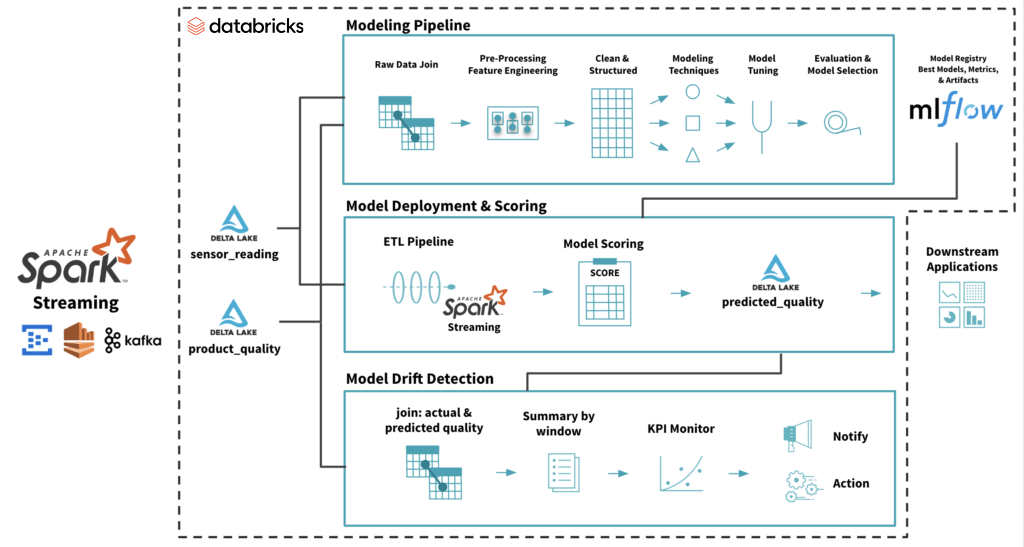
The example architecture shown below uses data from IoT sensors (features) and actual product quality (labels) as streaming sources from Delta Lake. From this data, you create a model to predict the product quality from IoT sensor data. Deployed production models in MLflow are loaded in the scoring pipeline to get predicted product quality (predicted labels).

To monitor drift, you join actual product quality (labels) and predicted quality (predicted labels) and summarize over a time window to trend model quality. This summarized KPI for monitoring model quality could vary depending on business needs and multiple such KPIs could be calculated to ensure ample coverage. See the code snippet below for an example.
Depending on how delayed actual labels arrive compared to predicted labels, this could be a significant lagging indicator. To provide some early warning of drift, this indicator can be accompanied by leading indicators such as the distribution of predicted quality labels. To avoid false alarms, such KPIs need to be designed with business context.
You can set the accurate prediction summary trend within control limits acceptable to business needs. The summary can then be monitored using standard statistical process control methods. When the trend goes out of these control limits, it can trigger a notification or an action to recreate a new model using newer data.

Next Steps
Follow the instructions in this GitHub repo, to reproduce the example above and to adapt for your use cases. To provide more context, see the accompanying webinar, Productionizing Machine Learning - From Deployment to Drift Detection.
Get the latest posts in your inbox
Subscribe to our blog and get the latest posts delivered to your inbox.