Ten Simple Databricks Notebook Tips & Tricks for Data Scientists
by Jules Damji
Often, small things make a huge difference, hence the adage that "some of the best ideas are simple!" Over the course of a few releases this year, and in our efforts to make Databricks simple, we have added several small features in our notebooks that make a huge difference.
In this blog and the accompanying notebook, we illustrate simple magic commands and explore small user-interface additions to the notebook that shave time from development for data scientists and enhance developer experience.
Collectively, these enriched features include the following:
- %pip install
- %conda env export and update
- %matplotlib inline
- %load_ext tensorboard and %tensorboard
- %run auxiliary notebooks to modularize code
- Upload data
- MLflow: Dynamic Experiment counter and Reproduce run button
- Simple UI nuggets and nudges
- Format SQL code
- Web terminal to log into the cluster
For brevity, we summarize each feature usage below. However, we encourage you to download the notebook. If you don’t have Databricks Unified Analytics Platform yet, try it out here. Import the notebook in your Databricks Unified Data Analytics Platform and have a go at it.
1. Magic command %pip: Install Python packages and manage Python Environment
Databricks Runtime (DBR) or Databricks Runtime for Machine Learning (MLR) installs a set of Python and common machine learning (ML) libraries. But the runtime may not have a specific library or version pre-installed for your task at hand. To that end, you can just as easily customize and manage your Python packages on your cluster as on laptop using %pip and %conda.
Before the release of this feature, data scientists had to develop elaborate init scripts, building a wheel file locally, uploading it to a dbfs location, and using init scripts to install packages. This is brittle. Now, you can use %pip install from your private or public repo.
%pip install vaderSentiment
Alternatively, if you have several packages to install, you can use %pip install -r
To further understand how to manage a notebook-scoped Python environment, using both pip and conda, read this blog.
2. Magic command %conda and %pip: Share your Notebook Environments
Once your environment is set up for your cluster, you can do a couple of things: a) preserve the file to reinstall for subsequent sessions and b) share it with others.
Since clusters are ephemeral, any packages installed will disappear once the cluster is shut down. A good practice is to preserve the list of packages installed. This helps with reproducibility and helps members of your data team to recreate your environment for developing or testing. With %conda magic command support as part of a new feature released this year, this task becomes simpler: export and save your list of Python packages installed.
%conda env export -f /jsd_conda_env.yml or %pip freeze > /jsd_pip_env.txt
From a common shared or public dbfs location, another data scientist can easily use %conda env update -f to reproduce your cluster's Python packages' environment.
3. Magic command %matplotlib inline: Display figures inline
As part of an Exploratory Data Analysis (EDA) process, data visualization is a paramount step. After initial data cleansing of data, but before feature engineering and model training, you may want to visually examine to discover any patterns and relationships.
Among many data visualization Python libraries, matplotlib is commonly used to visualize data. Although DBR or MLR includes some of these Python libraries, only matplotlib inline functionality is currently supported in notebook cells.
With this magic command built-in in the DBR 6.5+, you can display plots within a notebook cell rather than making explicit method calls to display(figure) or display(figure.show()) or setting spark.databricks.workspace.matplotlibInline.enabled = true.
4. Magic command %tensorboard with PyTorch or TensorFlow
Recently announced in a blog as part of the Databricks Runtime (DBR), this magic command displays your training metrics from TensorBoard within the same notebook. This new functionality deprecates the dbutils.tensorboard.start(), which requires you to view TensorBoard metrics in a separate tab, forcing you to leave the Databricks notebook and breaking your flow.
No longer must you leave your notebook and launch TensorBoard from another tab. The inplace visualization is a major improvement toward simplicity and developer experience.
While you can use either TensorFlow or PyTorch libraries installed on a DBR or MLR for your machine learning models, we use PyTorch (see the notebook for code and display), for this illustration.
%load_ext tensorboard
%tensorboard --logdir=./runs
5. Magic command %run to instantiate auxiliary notebooks
Borrowing common software design patterns and practices from software engineering, data scientists can define classes, variables, and utility methods in auxiliary notebooks. That is, they can "import"—not literally, though—these classes as they would from Python modules in an IDE, except in a notebook's case, these defined classes come into the current notebook's scope via a %run auxiliary_notebook command.
Though not a new feature as some of the above ones, this usage makes the driver (or main) notebook easier to read, and a lot less clustered. Some developers use these auxiliary notebooks to split up the data processing into distinct notebooks, each for data preprocessing, exploration or analysis, bringing the results into the scope of the calling notebook.
Another candidate for these auxiliary notebooks are reusable classes, variables, and utility functions. For example, Utils and RFRModel, along with other classes, are defined in auxiliary notebooks, cls/import_classes. After the %run ./cls/import_classes, all classes come into the scope of the calling notebook. With this simple trick, you don't have to clutter your driver notebook. Just define your classes elsewhere, modularize your code, and reuse them!
6. Fast Upload new data
Sometimes you may have access to data that is available locally, on your laptop, that you wish to analyze using Databricks. A new feature Upload Data, with a notebook File menu, uploads local data into your workspace. The target directory defaults to /shared_uploads/your-email-address; however, you can select the destination and use the code from the Upload File dialog to read your files. In our case, we select the pandas code to read the CSV files.
Once uploaded, you can access the data files for processing or machine learning training.
7.1 MLflow Experiment Dynamic Counter
The MLflow UI is tightly integrated within a Databricks notebook. As you train your model using MLflow APIs, the Experiment label counter dynamically increments as runs are logged and finished, giving data scientists a visual indication of experiments in progress.
By clicking on the Experiment, a side panel displays a tabular summary of each run's key parameters and metrics, with ability to view detailed MLflow entities: runs, parameters, metrics, artifacts, models, etc.
7.2 MLflow Reproducible Run button
Another feature improvement is the ability to recreate a notebook run to reproduce your experiment. From any of the MLflow run pages, a Reproduce Run button allows you to recreate a notebook and attach it to the current or shared cluster.
8. Simple UI nuggets and task nudges
To offer data scientists a quick peek at data, undo deleted cells, view split screens, or a faster way to carry out a task, the notebook improvements include:
Light bulb hint for better usage or faster execution: Whenever a block of code in a notebook cell is executed, the Databricks runtime may nudge or provide a hint to explore either an efficient way to execute the code or indicate additional features to augment the current cell's task. For example, if you are training a model, it may suggest to track your training metrics and parameters using MLflow.
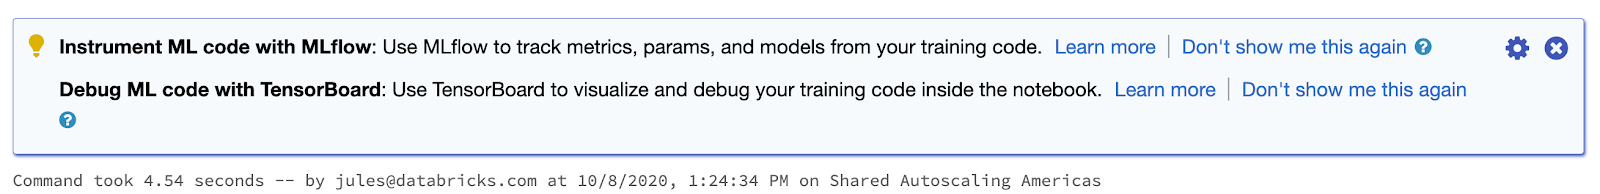
Or if you are persisting a DataFrame in a Parquet format as a SQL table, it may recommend to use Delta Lake table for efficient and reliable future transactional operations on your data source. Also, if the underlying engine detects that you are performing a complex Spark operation that can be optimized or joining two uneven Spark DataFrames—one very large and one small—it may suggest that you enable Apache Spark 3.0 Adaptive Query Execution for better performance.
These little nudges can help data scientists or data engineers capitalize on the underlying Spark's optimized features or utilize additional tools, such as MLflow, making your model training manageable.
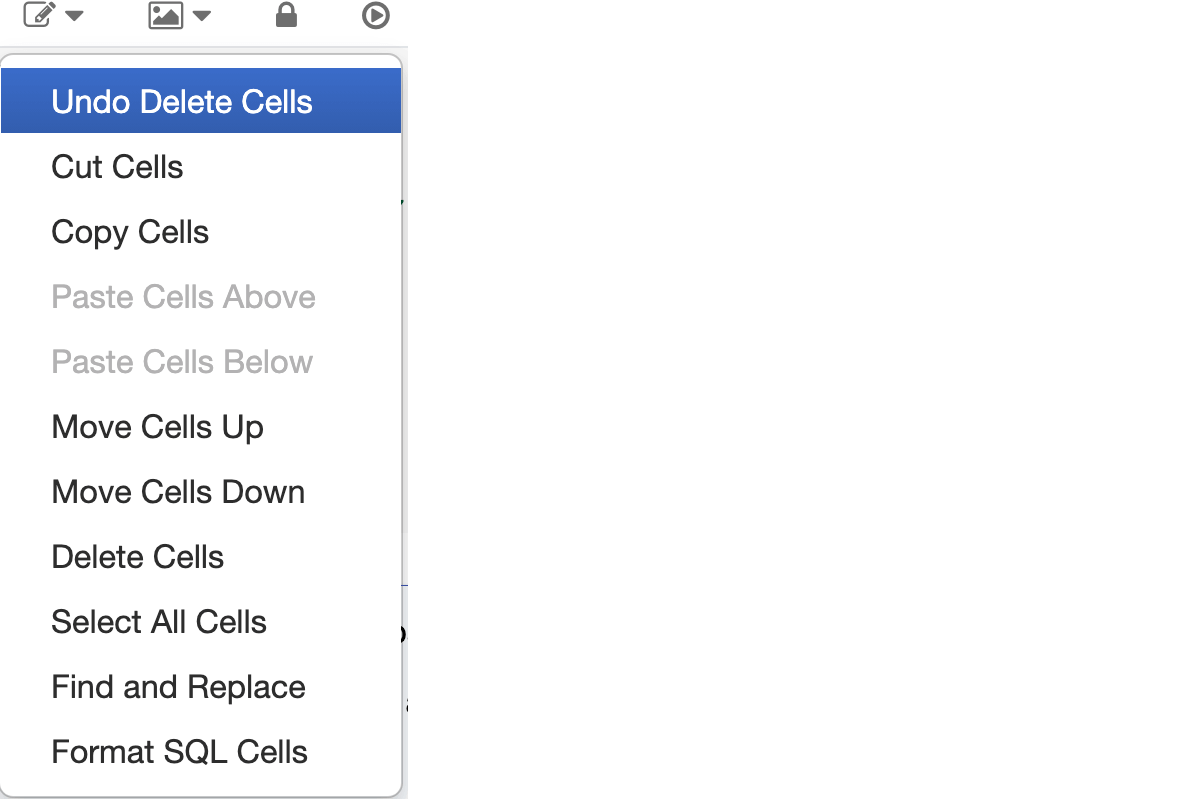
Undo deleted cells: How many times you have developed vital code in a cell and then inadvertently deleted that cell, only to realize that it's gone, irretrievable. Now you can undo deleted cells, as the notebook keeps tracks of deleted cells.
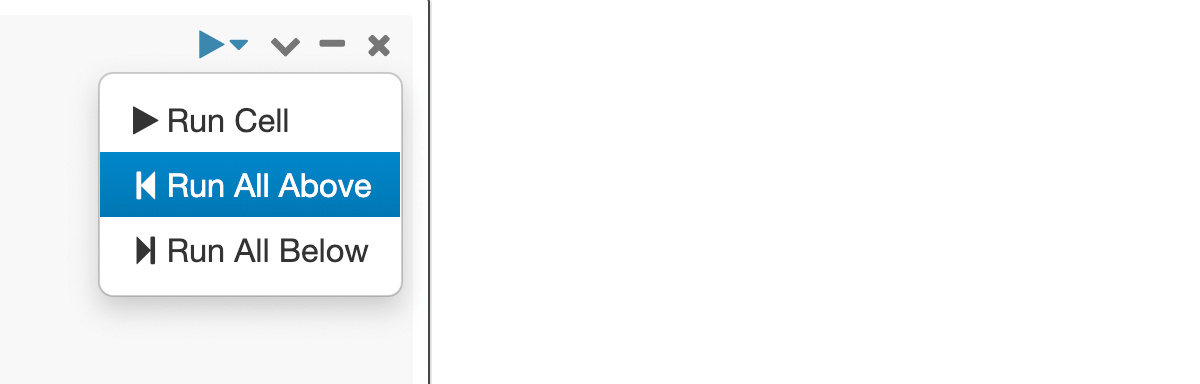
Run All Above: In some scenarios, you may have fixed a bug in a notebook’s previous cells above the current cell and you wish to run them again from the current notebook cell. This old trick can do that for you.
Tab for code completion and function signature: Both for general Python 3 functions and Spark 3.0 methods, using a method_name.tab key shows a drop down list of methods and properties you can select for code completion.
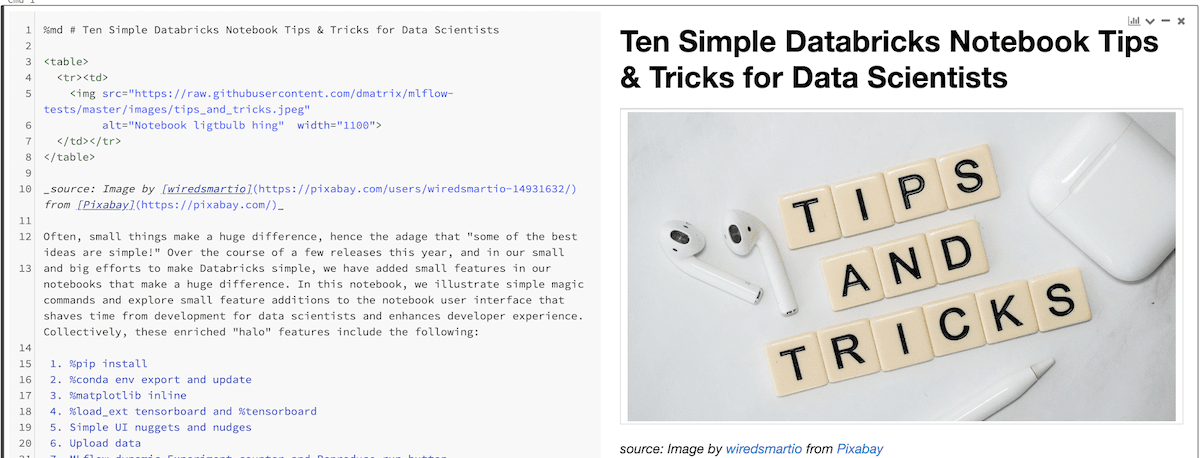
Use Side-by-Side view:
As in a Python IDE, such as PyCharm, you can compose your markdown files and view their rendering in a side-by-side panel, so in a notebook. Select the View->Side-by-Side to compose and view a notebook cell.
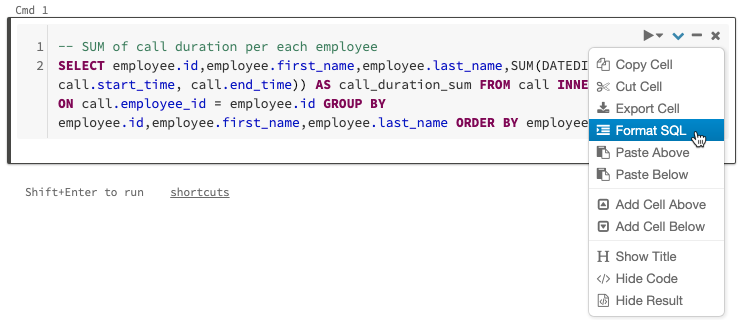
9. Format SQL code
Though not a new feature, this trick affords you to quickly and easily type in a free-formatted SQL code and then use the cell menu to format the SQL code.
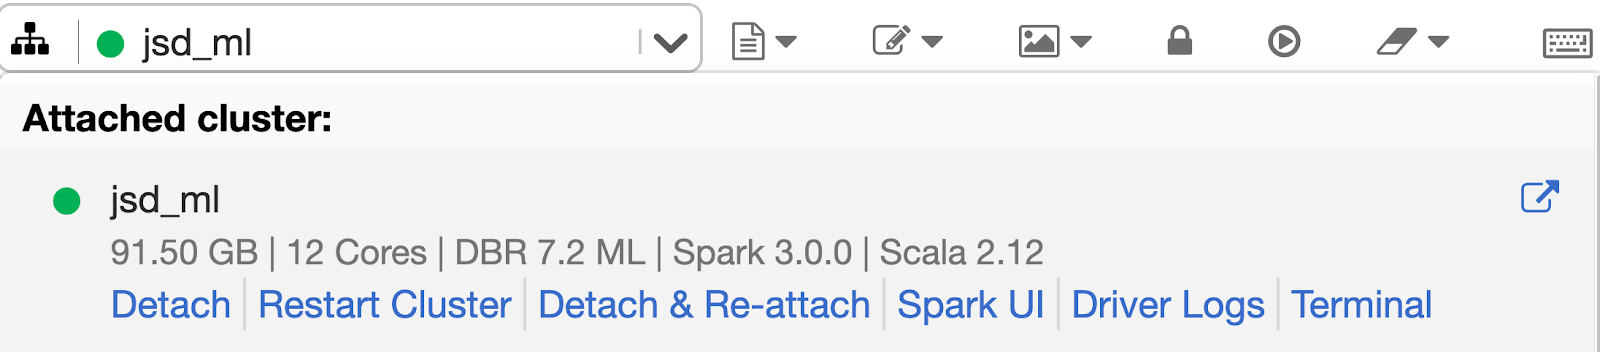
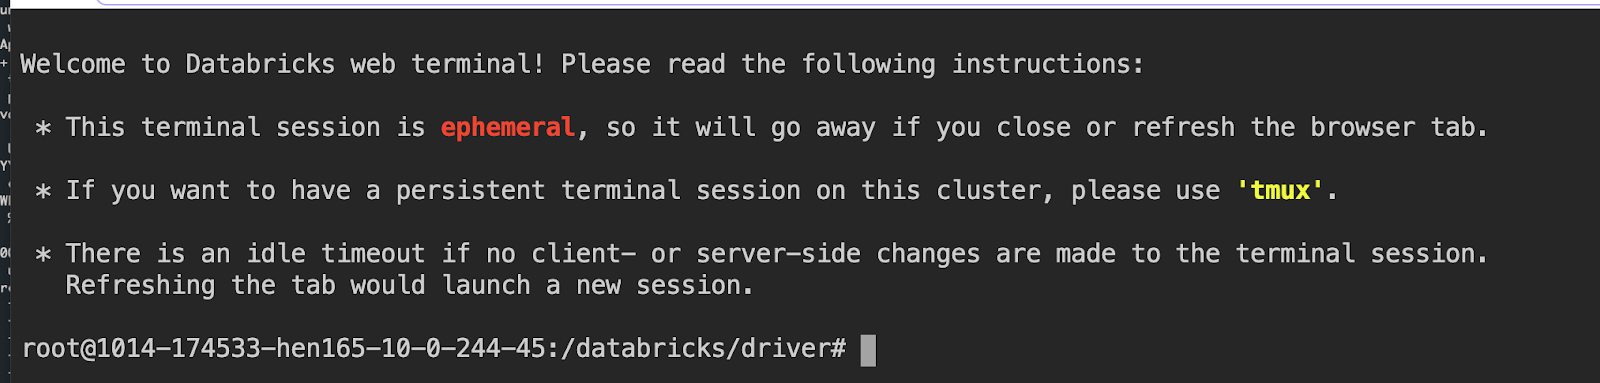
10. Web terminal to log into the cluster
Any member of a data team, including data scientists, can directly log into the driver node from the notebook. No need to use %sh ssh magic commands, which require tedious setup of ssh and authentication tokens. Moreover, system administrators and security teams loath opening the SSH port to their virtual private networks. As a user, you do not need to setup SSH keys to get an interactive terminal to a the driver node on your cluster. If your Databricks administrator has granted you "Can Attach To" permissions to a cluster, you are set to go.
Announced in the blog, this feature offers a full interactive shell and controlled access to the driver node of a cluster. To use the web terminal, simply select Terminal from the drop down menu.
Collectively, these features—little nudges and nuggets—can reduce friction, make your code flow easier, to experimentation, presentation, or data exploration. Give one or more of these simple ideas a go next time in your Databricks notebook.
Download the notebook today and import it to Databricks Unified Data Analytics Platform (with DBR 7.2+ or MLR 7.2+) and have a go at it.
To discover how data teams solve the world's tough data problems, come and join us at the Data + AI Summit Europe.
Get the latest posts in your inbox
Subscribe to our blog and get the latest posts delivered to your inbox.