How DPG Delivers High-Quality and Marketable Segments to Its Advertisers

This is a guest authored post by Bart Del Piero, Data Scientist, DPG Media.
At the start of a campaign, marketers and publishers will often have a hypothesis of who the target segment will be, but once a campaign starts, it can be very difficult to see who actually responds, abstract a segment based on the different qualities of the different respondents, and then adjust targeting based off those segments in a timely manner. Machine learning, however, can make it possible to sift through large volumes of respondent and non-respondent audience data in near real-time to automatically create lookalike audiences specific to the good or service being advertised, increasing advertising ROI (and the price publishers can charge for their ad inventory while still increasing the value for their clients).
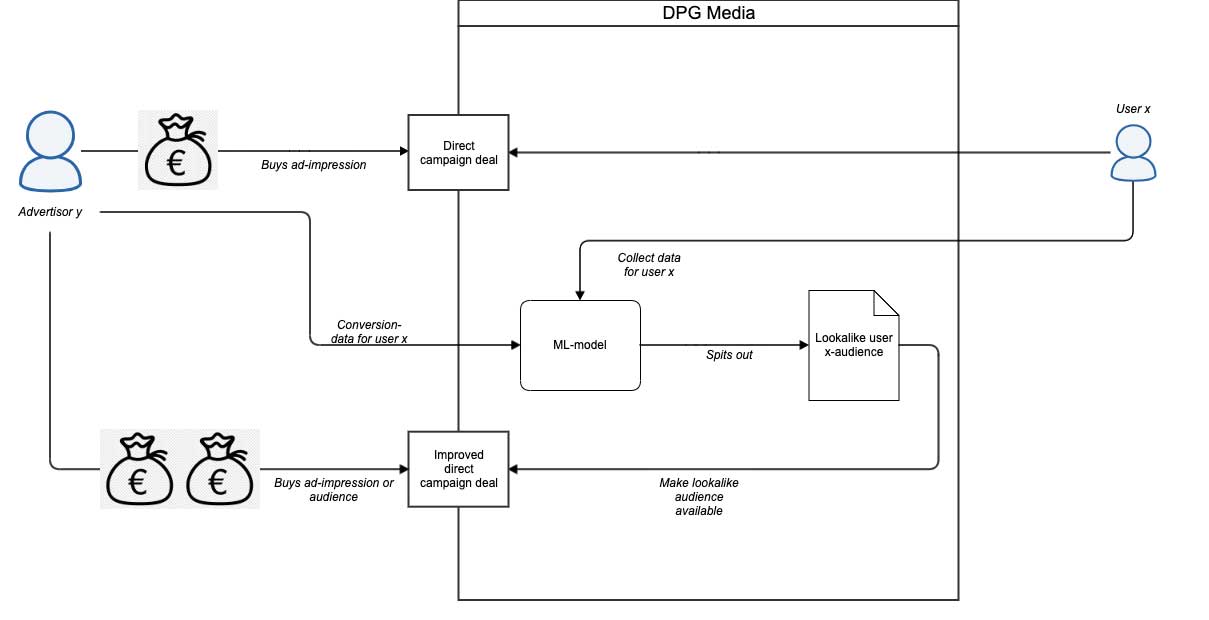
In the targeted advertising space at DPG Media, we try to find new ways to best deliver high-quality and marketable segments to our advertisers. One approach to optimizing marketing campaigns is through the use of ‘low time to market’-lookalikes of high-value clickers and presenting them to the advertiser as an improved deal.
This would entail building a system that allows us to train a classification model that ‘learns’ during the campaign lifetime based on a continuous feed of data (mostly through daily batches), which results in daily updated and improved target audiences for multiple marketing and ad campaigns. This logic can be visualized as follows:
This results in two main questions:
- Can we create a lookalike model that learns campaign click-behaviour over time?
- Can this entire setup run smoothly and with a low runtime to maximize revenue?
To answer these questions, this blog post focuses on two technologies within the Databricks environment: Hyperopt and PandasUDF.
Hyperopt
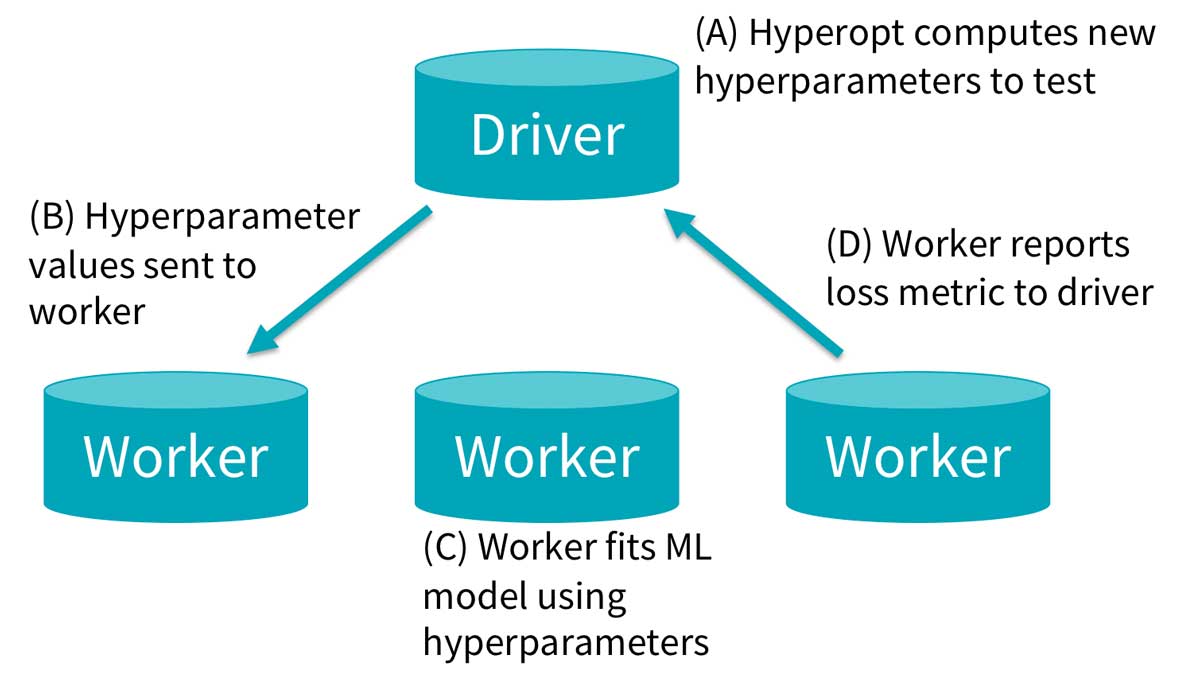
In a nutshell, Hyperopt allows us to quickly train and fit multiple sklearn-models across multiple executors for hyperparameter tuning and can search for the optimal configuration based on previous evaluations. As we try and fit multiple models per campaign, for multiple campaigns, this allows us to quickly get the best hyperparameter configuration, resulting in the best loss, in a very short time period (eg: around 14 minutes for preprocessing and optimizing a random forest with 24 evaluations and a parallelism-parameter of 16). Important here is that our label is the propensity to click (i.e., a probability), rather than being a clicker (a class). Afterward, the model with the lowest loss (defined as – AUC of the Precision-Recall), is written to MLflow. This process is done once a week or if the campaign has just started and we get more data for that specific campaign compared to the previous day.
PandasUDF
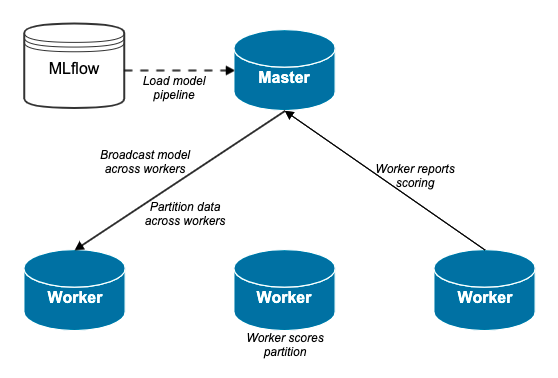
After we have our model, we want to draw inferences on all visitors of our sites for the last 30 days. To do this, we query the latest, best model from MLflow and broadcast this over all executors. Because the data set we want to score is quite large, we distribute it in n-partitions and let each executor score a different partition; all of this is done by leveraging the PandasUDF-logic. The probabilities then get collected back to the driver, and users get ranked from lowest propensity to click, to highest propensity to click:

After this, we select a threshold based on volume vs quality (this is a business-driven choice depending on how much ad-space we have for a given campaign) and create a segment for it in our data management platform (DMP).
Conclusion
In short, we can summarize the entire process as follows
This entire process runs around one hour per campaign if we retrain the models. If not, it takes about 30 minutes per day to load and score new audiences. We aim to keep the runtime as low as possible so we can account for more campaigns. In terms of the quality of these audiences, they can differ significantly, after all, there is no such thing as a free lunch in machine learning.
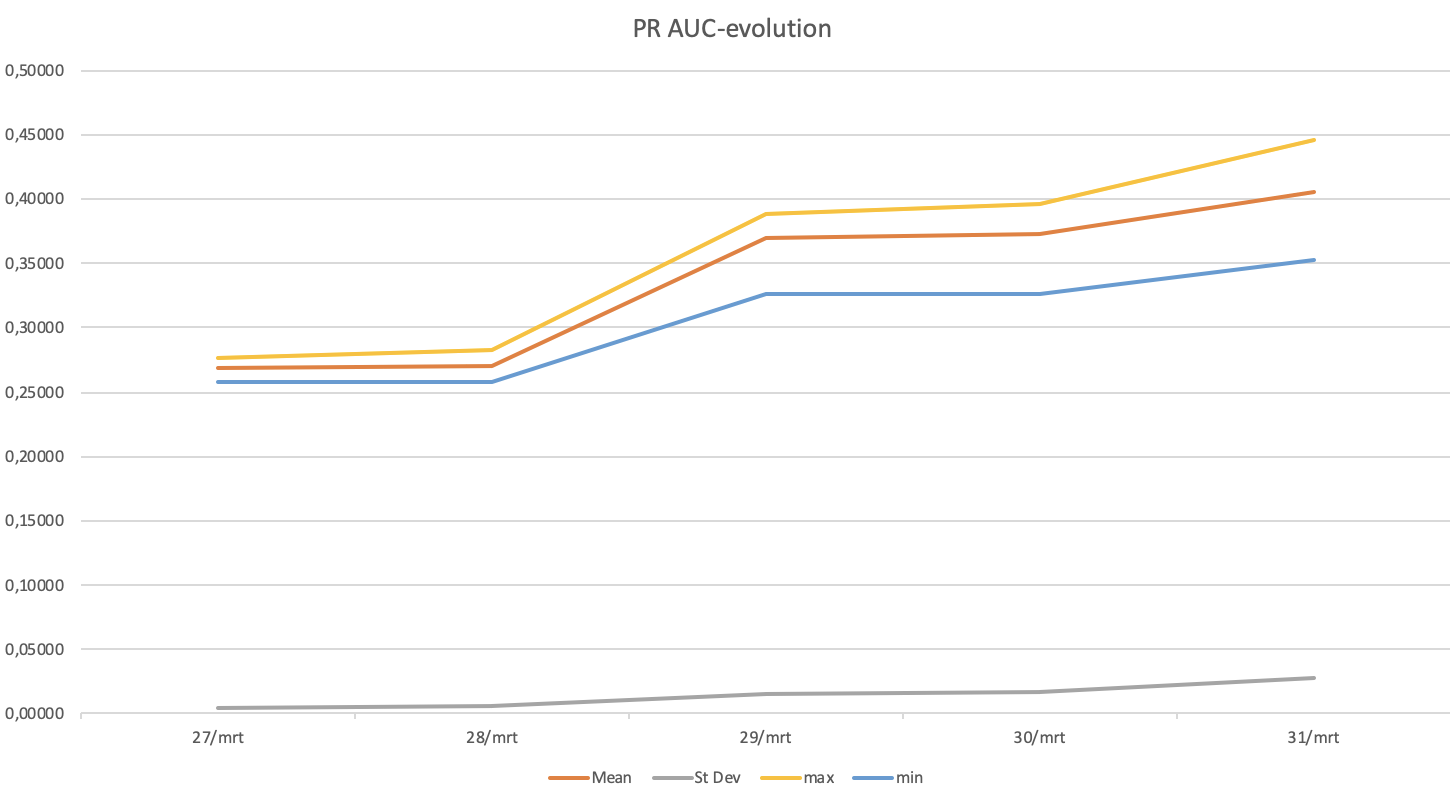
For new campaigns without many conversions, we see the model improving when more data is gathered in daily batches and our estimates are getting better. For example, for a random campaign where:
- Mean: Average Precision-Recall AUC of all evaluations within the daily hyperopt-run
- Max: Highest Precision-Recall AUC of an evaluation within the daily hyperopt-run
- Min: Lowest Precision-Recall AUC of an evaluation within the daily hyperopt-run
- St Dev: Standard deviation Precision-Recall AUC of all evaluations within the daily hyperopt-run
AUC of precision-recall aside, for advertisers, the most important metric is the click-through rate. We tested this model for two ad campaigns and compared it to a normal run-off network campaign. This produced the following results:
Of course, as there is no free lunch, it is important to realize that there is no single quality metric across campaigns and evaluation must be done on a campaign-per-campaign basis.
Never miss a Databricks post
What's next?

Technology
December 9, 2024/6 min read
Scale Faster with Data + AI: Insights from the Databricks Unicorns Index

News
December 11, 2024/4 min read


