Pandas-Profiling Now Supports Apache Spark
pandas-profiling is now ydata-profiling

Data profiling is the process of collecting statistics and summaries of data to assess its quality and other characteristics. It is an essential step in both data discovery and the data science lifecycle because it helps us ensure quality data flows from which we can derive trustworthy and actionable insights. Profiling involves analyzing data across both univariate and multivariate perspectives. Manual generation of this analysis is limited, time-consuming, and potentially error-prone, especially for large datasets.
Databricks recognizes the need for data-centric ML platforms, which is why Databricks Notebooks already offer built-in support for profiling via the data profile tab and the summarize command. Databricks is also a strong supporter of open source software, and always ensures customers can use any open source tools they need to tackle their toughest data and AI problems. That's why we are excited to work together with YData on this joint blog post about pandas-profiling, their open-source library for data profiling.
Now supporting Spark DataFrames and with a new name, ydata-profiling brings another option to tackle data profiling needs at scale. It can be seamlessly integrated with Databricks, enabling sophisticated analysis on big data with minimal effort. In what follows, we will detail how you can incorporate ydata-profiling into your Databricks Notebooks and data flows to fully leverage the power of data profiling with just a few lines of code. Let's get started!
Data Profiling with ydata-profiling: from standard EDA to best practices in Data Quality
Since the launch of pandas-profiling, support for Apache Spark DataFrames has been one of the most frequently requested features. This feature is now available in the latest release (4.0.0), and the package is also being officially renamed to ydata-profiling to reflect this broader support. The open-source package is publicly available on GitHub and is extensively used as a standalone library by a large community of data professionals. While pandas-profiling has always worked great in Databricks for profiling pandas DataFrames, the addition of Spark DataFrame support in ydata-profiling allows users to take the most out of their big data flows.
A well-rounded data profiling process encompasses four main components:
- Data Overview: Summarizing the main characteristics of the data such as the number and type of features, the number of available observations, and the overall percentage of missing values and duplicate records in data.
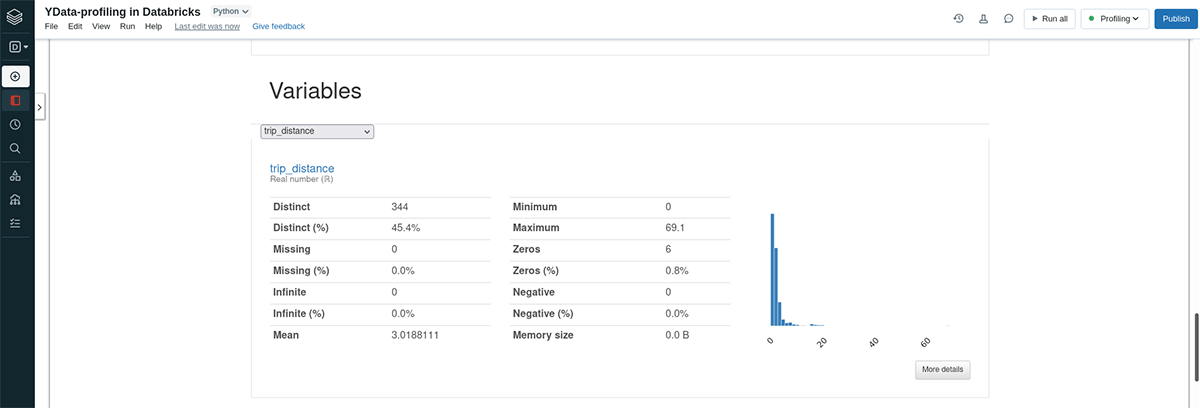
- Univariate Analysis and Feature Statistics: Zooming in on each feature in the dataset, we can look into their properties either by reporting key statistics or producing insightful visualizations. In this regard, ydata-profiling provides the type of each feature along with statistics based on whether they're numeric or categorical. Numerical features are summarized via the range, mean, median, deviation, skewness, kurtosis, histograms, and distribution curves. Categorical features are described using mode, category analysis, frequency tables, and bar plots.
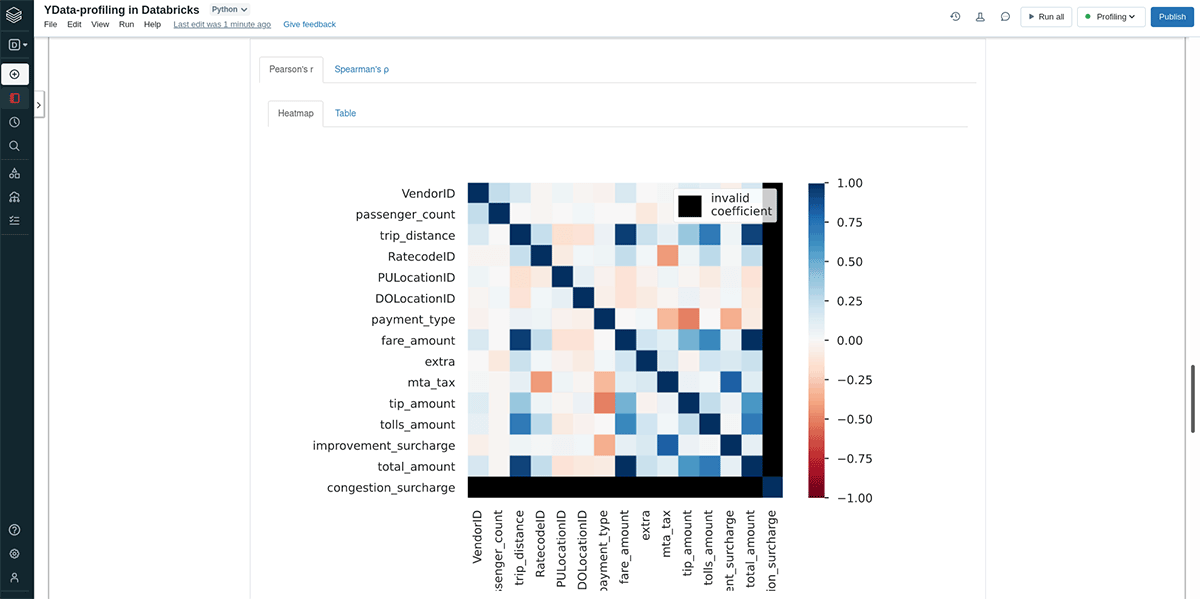
- Multivariate Analysis and Correlation Assessment: In this step we investigate existing relationships between features, often via correlation coefficients and interaction visualization. In ydata-profiling, correlations are assessed using a matrix or a heatmap whereas interactions are best explored using provided pairwise scatter plots.
- Data Quality Evaluation: Here we are signaling potentially critical data quality issues that require further investigation before model development. Currently supported data alerts include constant, zero, unique, and infinite values, skewed distributions, high correlation and cardinality, missing values, and class imbalance, for which custom thresholds can be customized by the user.
Performing a continuous and standardized data profiling step is essential to fully understanding the data assets available within an organization. Without it, data teams can miss out on identification of important relationships among attributes, data quality issues, and many other problems that can directly impact your the ability to deliver effective machine learning solutions. It also enables efficient debugging and troubleshooting of data flows and the development of best practices in data management and quality control. This allows data professionals to quickly mitigate modeling errors on production often happening in real-time (e.g., rare events, data drifts, fairness constraints, or misalignment with project goals).
A Hands-On Guide to Apps on Databricks
Getting started with ydata-profiling in Databricks
For this tutorial we will use the NYC yellow taxi trip data. This is a well-known dataset from the community that contains taxi trips information, including pickup/drop-off, traveled distance and payment details.
Profiling this dataset in Databricks Notebooks is as simple as following these easy steps:
- Install ydata-profiling
- Read the data
- Configure, run, and display the profile report
Installing ydata-profiling
To start using ydata-profiling in your Databricks Notebooks, we can use one of two following options:
Install as a notebook-scoped library by running the code:
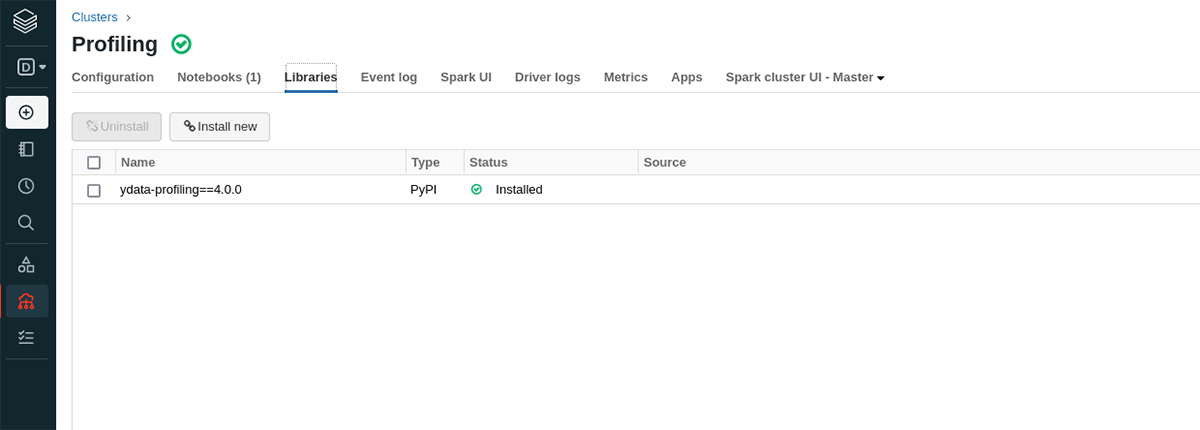
or, install the package in the compute cluster:

The decision will mainly depend on your flows, and whether you are looking into using the profiling in other notebooks.
Read the data
The NYC taxi dataset is pre-populated for all Databricks workspaces, so we'll load a file from there for our example. You can find this and other datasets in the databricks-datasets directory in DBFS. Feel free to load additional files as well, just note that you may need to scale the size of your cluster accordingly.
Now we can load the Delta table and use that as the basis of our processing. We cache the DataFrame here since the analysis may need to make many passes over the data.

Configure, run, and display the profile report
In order to be able to generate a profile for Spark DataFrames, we need to configure our ProfileReport instance. The default Spark DataFrames profile configuration can be found at ydata-profiling config module. This is required as some of the ydata-profiling Pandas DataFrames features are not (yet!) available for Spark DataFrames. The ProfileReport context can be set through the report constructor.
To display the report, we can either evaluate the report object as the last line of the command, or to be more explicit, extract the HTML and use displayHTML. We'll do the latter here. Note: the main processing happens the first time you run this and it can take a long time. Subsequent runs and evaluations will reuse the same analysis.


In addition to displaying the report as part of your command output, you can also easily save the calculated report as a separate HTML file. For instance, this makes it easy to share it with the rest of your organization.
Similarly, in case you want to integrate the report insights into downstream data workflows, you can extract and save the report as a JSON file.
Whether to write out HTML or JSON is determined by the file extension.
Conclusion
With the addition of Spark DataFrames support, ydata-profiling opens the door for both data profiling at scale as a standalone package, and for seamless integration with platforms already leveraging Spark, such as Databricks. Start leveraging this synergy on your large-scale use cases today: access the quickstart example here and try it for yourself!
Try out the new Spark support in ydata-profiling on Databricks today!

