Debug your code and notebooks by using Visual Studio Code
by Saad Ansari, Fabian Jakobs, Kartik Gupta and Vladislav Mantic-Lugo
Earlier this year we launched the official Databricks extension for Visual Studio Code. Today we are adding support for interactive debugging and local Jupyter (ipynb) notebook development using this extension!
Interactive debugging with Databricks Connect
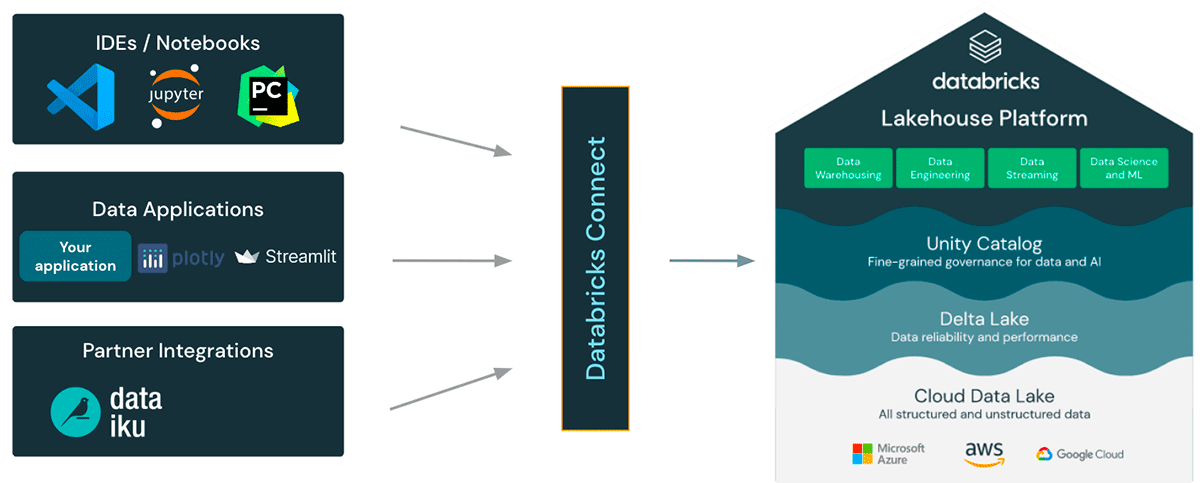
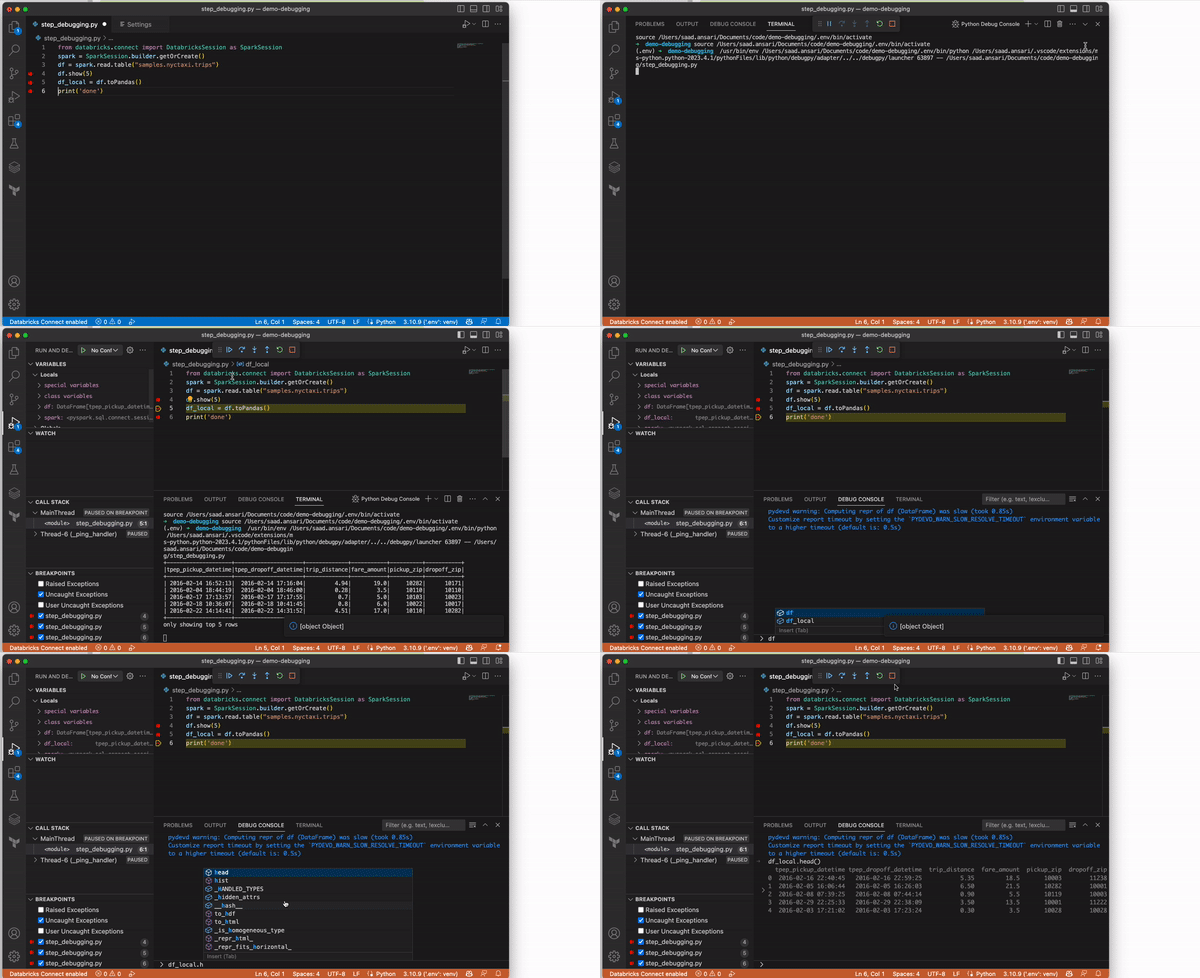
Data scientists and data engineers typically rely on print statements or logs to identify errors in their code which can be time-consuming and error-prone. With support for interactive debugging using Databricks Connect, developers can step through their code and inspect variables in real time. Databricks Connect enables running Spark code on remote clusters from the IDE, thereby enabling code step-through while debugging.


After you have set up your extension to use Databricks Connect (see "Easy Setup" below), simply use the VS Code "Debug Python File" button to start debugging. You can add breakpoints and step through your code as you would any other Python file. You also have the ability to inspect variables or run debug commands in the debug console.
Support for ipynb notebooks
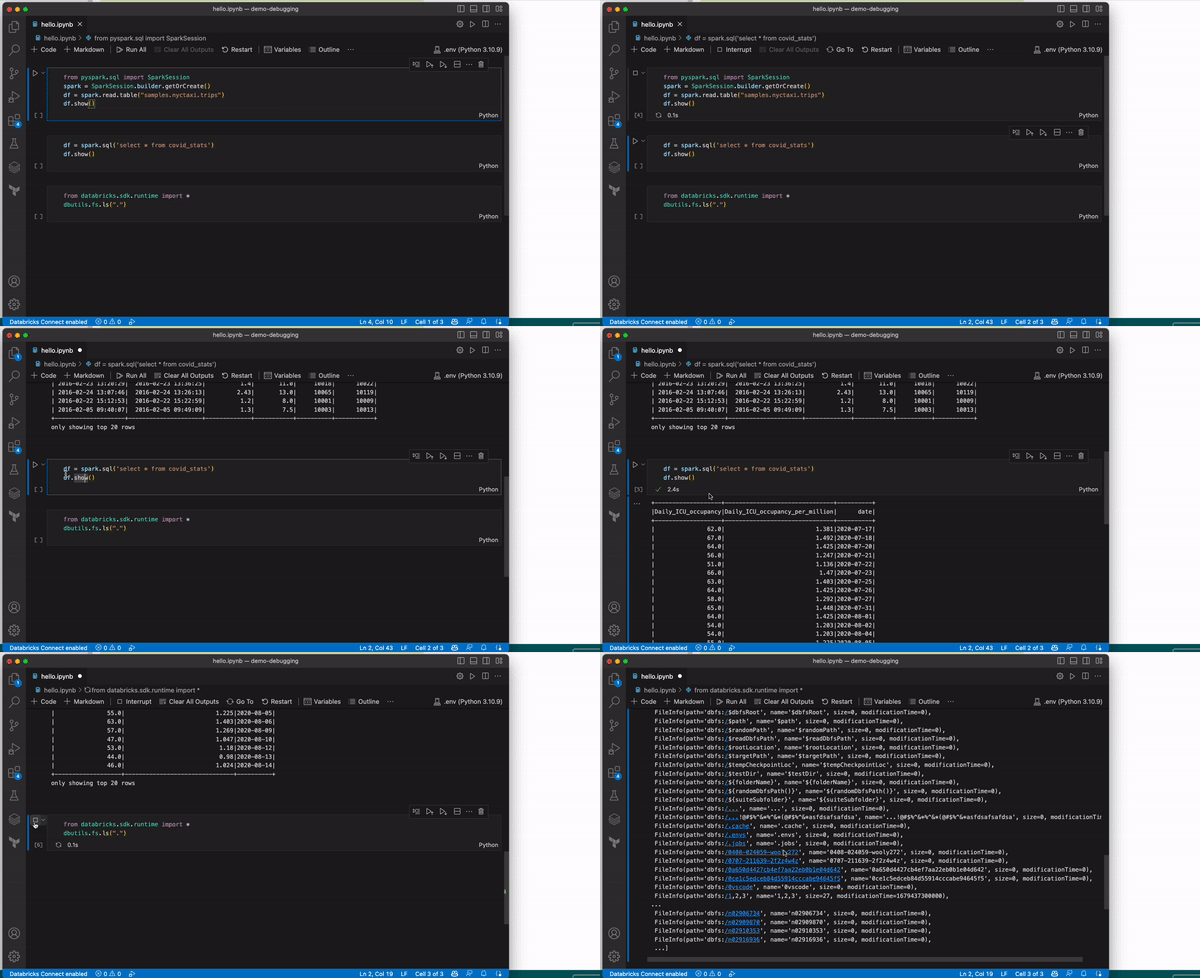
With this release, you can use the existing notebook functionality (such as running cell-by-cell execution for your exploratory data analysis) in Visual Studio Code as it supports the open ipynb format.

Support for DBUtils and Spark SQL
Additionally, you can run Spark SQL and have limited support for running the popular tool "dbutils". You can import dbutils using the following code block:
Easy setup
The feature will be enabled by default soon, but for now you need to enable it manually:
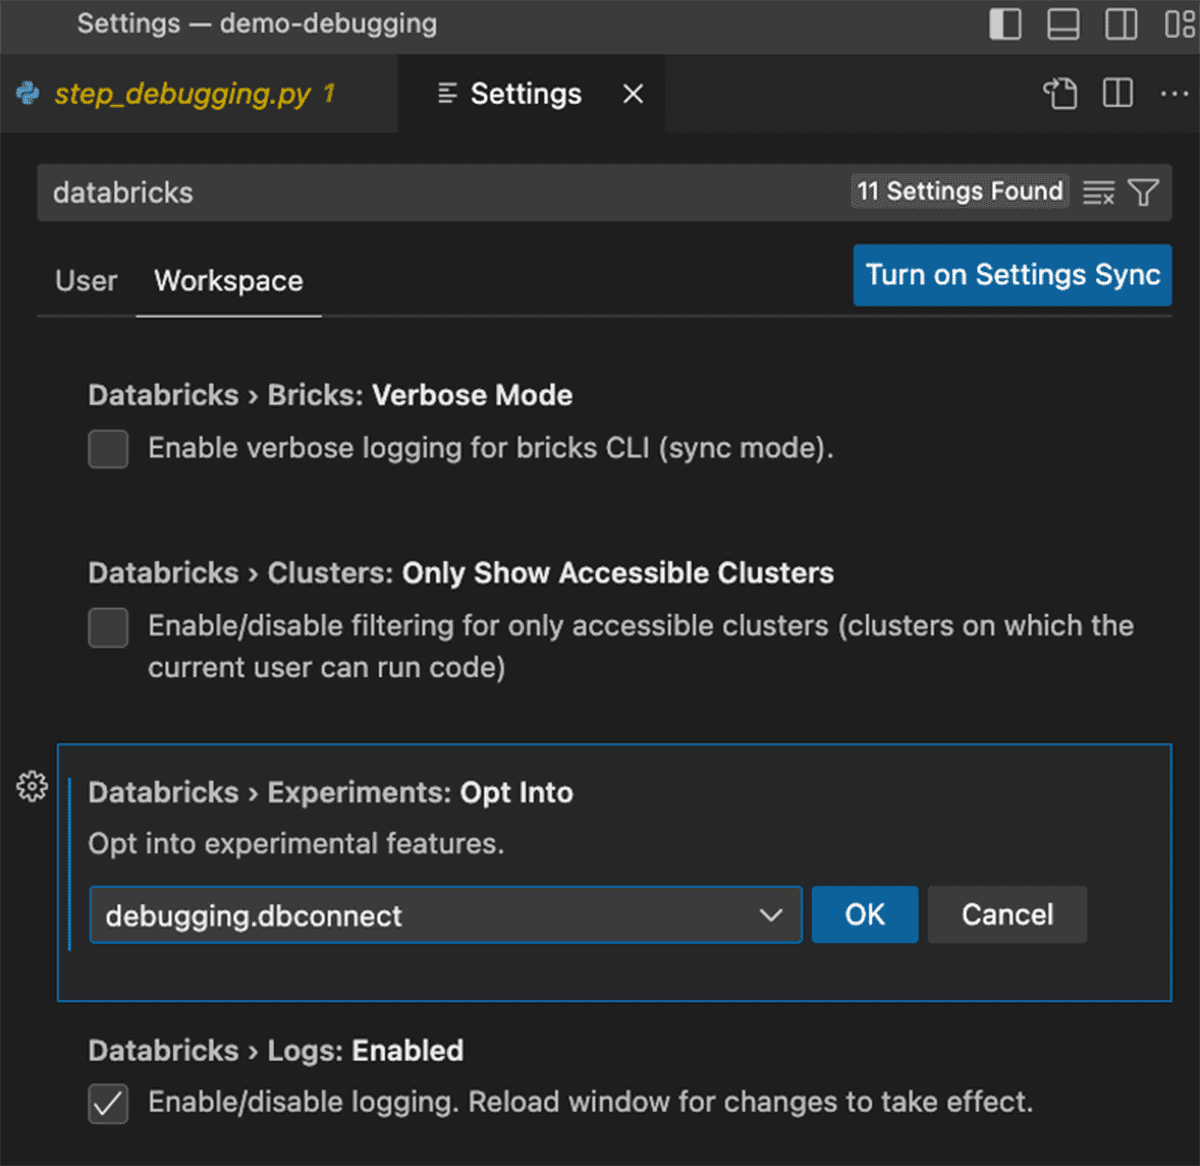
- Under the command palette type in "Preferences Open Settings (UI)".
- Under the "Workspace" tab search for "Databricks" and select "Databricks > Experiments: Opt Into"
- Enter "debugging.dbconnect" - it should be available as an autocomplete option
- Reload VS Code and you will see a small red banner at the bottom: "Databricks Connect disabled"
- Once you click it, you will be prompted to install Databricks Connect into your virtual environment.


Configuring your Spark session
As long as your Visual Studio extension is configured, your spark session will be initialized using your existing settings to connect to your remote cluster. You can get a reference to it using the snippet below:
Try out interactive debugging today, using a regular Python file or using an ipynb notebook to develop your Python code!
Download the VS Code Extension from the Visual Studio Marketplace
Please take a look at our documentation for AWS, Azure, and GCP for help with how to get started using the extension, and give it a try.
We would love to hear your feedback at the Databricks Community about this extension or any other aspect of the development experience.
Get the latest posts in your inbox
Subscribe to our blog and get the latest posts delivered to your inbox.