Supernovas, Black Holes and Streaming Data
A Journey in Space With Apache Kafka and the Databricks Data Intelligence Platform
Overview
This blog post is a follow-up to the session From Supernovas to LLMs at Data + AI Summit 2024, where I demonstrated how anyone can consume and process publicly available NASA satellite data from Apache Kafka.
Unlike most Kafka demos, which are not easily reproducible or rely on simulated data, I will show how to analyze a live data stream from NASA's publicly accessible Gamma-ray Coordinates Network (GCN) which integrates data from supernovas and black holes coming from various satellites.
While it's possible to craft a solution using only open source Apache Spark™ and Apache Kafka, I will show the significant advantages of using the Databricks Data Intelligence Platform for this task. Also, the source code for both approaches will be provided.
The solution built on the Data Intelligence Platform leverages Delta Live Tables with serverless compute for data ingestion and transformation, Unity Catalog for data governance and metadata management, and the power of AI/BI Genie for natural language querying and visualization of the NASA data stream. The blog also showcases the power of Databricks Assistant for the generation of complex SQL transformations, debugging and documentation.
Supernovas, black holes and gamma-ray bursts
The night sky is not static. Cosmic events like supernovas and the formation of black holes happen frequently and are accompanied by powerful gamma-ray bursts (GRBs). Such gamma-ray bursts often last only two seconds, and a two-second GRB typically releases as much energy as the Sun's during its entire lifetime of some 10 billion years.
During the Cold War, special satellites built to detect covert nuclear weapon tests coincidentally discovered these intense flashes of gamma radiation originating from deep space. Today, NASA utilizes a fleet of satellites like Swift and Fermi to detect and study these bursts that originated billions of years ago in remote galaxies. The green line in the following animation shows the SWIFT satellite's orbit at 11 AM CEST on August 1, 2024, generated with Satellite Tracker 3D, courtesy of Marko Andlar.
GRB 221009A, one of the brightest and most energetic GRBs ever recorded, blinded most instruments because of its energy. It originated from the constellation of Sagitta and is believed to have occurred approximately 1.9 billion years ago. However, due to the expansion of the universe over time, the source of the burst is now about 2.4 billion light-years away from Earth. GRB 221009A is shown in the image below.
Wikipedia. July 18, 2024. "GRB 221009A." https://en.wikipedia.org/wiki/GRB_221009A.
Modern astronomy now embraces a multi-messenger approach, capturing various signals together such as neutrinos in addition to light and gamma rays. The IceCube observatory at the South Pole, for example, uses over 5,000 detectors embedded within a cubic kilometer of Antarctic ice to detect neutrinos passing through the Earth.
The Gamma-ray Coordinates Network project connects these advanced observatories — links supernova data from space satellites and neutrino data from Antarctica — and makes NASA's data streams accessible worldwide.
While analyzing data from NASA satellites may seem daunting, I'd like to demonstrate how easily any data scientist can explore these scientific data streams using the Databricks Data Intelligence Platform, thanks to its robust tools and pragmatic abstractions.
As a bonus, you will learn about one of the coolest publicly available data streams that you can easily reuse for your own studies.
Now, let me explain the steps I took to tackle this challenge.
Consuming Supernova Data From Apache Kafka
Getting OICD token from GCN Quickstart
NASA offers the GCN data streams as Apache Kafka topics where the Kafka broker requires authentication via an OIDC credential. Obtaining GCN credentials is straightforward:
- Visit the GCN Quickstart page
- Authenticate using Gmail or other social media accounts
- Receive a client ID and client secret
The Quickstart will create a Python code snippet that utilizes the GCN Kafka broker, which is built on the Confluent Kafka codebase.
It's important to note that while the GCN Kafka wrapper prioritizes ease of use, it also abstracts most technical details such as the Kafka connection parameters for OAuth authentication.
The open source way with Apache Spark™
To learn more about that supernova data, I decided to begin with the most general open source solution that would give me full control over all parameters and configurations. So I implemented a POC with a notebook using Spark Structured Streaming. At its core, it boils down to the following line:
Of course, the crucial detail here is in the **kafka_config connection details which I extracted from the GCN wrapper. The full Spark notebook is provided on GitHub (see repo at the end of the blog).
My ultimate goal, however, was to abstract the lower-level details and create a stellar data pipeline that benefits from Databricks Delta Live Tables (DLT) for data ingestion and transformation.
Incrementally ingesting supernova data from GCN Kafka with Delta Live Tables
There were several reasons why I chose DLT:
- Declarative approach: DLT allows me to focus on writing the pipeline declaratively, abstracting much of the complexity. I can focus on the data processing logic making it easier to build and maintain my pipeline while benefiting from Databricks Assistant, Auto Loader and AI/BI.
- Serverless infrastructure: With DLT, infrastructure management is fully automated and compute resources are provisioned serverless, eliminating manual setup and configuration. This enables advanced features such as incremental materialized view computation and vertical autoscaling, allowing for efficient, scalable and cost-efficient data processing.
- End-to-end pipeline development in SQL: I wanted to explore the possibility of using SQL for the entire pipeline, including ingesting data from Kafka with OIDC credentials and complex message transformations.
This approach allowed me to streamline the development process and create a simple, scalable and serverless pipeline for cosmic data without getting bogged down in infrastructure details.
A DLT data pipeline can be coded entirely in SQL (Python is available too, but only required for some rare metaprogramming tasks, i.e., if you want to write code that creates pipelines).
With DLT's new improvements for developers, you can write code in a notebook and connect it to a running pipeline. This integration brings the pipeline view and event log directly into the notebook, creating a streamlined development experience. From there, you can validate and run your pipeline, all within a single, optimized interface — essentially a mini-IDE for DLT.
DLT streaming tables
DLT uses streaming tables to ingest data incrementally from all kinds of cloud object stores or message brokers. Here, I use it with the read_kafka() function in SQL to read data directly from the GCN Kafka broker into a streaming table.
This is the first important step in the pipeline to get data off the Kafka broker. On the Kafka broker, data lives for a fixed retention period only, but once ingested to the lakehouse, the data is persisted permanently and can be used for any kind of analytics or machine learning.
Ingesting a live data stream is possible because of the underlying Delta data format. Delta tables are the high-speed data format for DWH applications, and you can simultaneously stream data to (or from) a Delta table.
The code to consume the data from the Kafka broker with Delta Live Tables looks as follows:
For brevity, I omitted the connection setting details in the example above (full code in GitHub).
By clicking on Unity Catalog Sample Data in the UI, you can view the contents of a Kafka message after it has been ingested:
As you can see, the SQL retrieves the entire message as a single entity composed of lines, each containing a keyword and value.
Note: The Swift messages contain the details of when and how a satellite slews into position to observe a cosmic event like a GRB.
As with my Kafka client above, some of the largest telescopes on Earth, as well as smaller robotic telescopes, pick up those messages. Based on the merit value of the event, they decide whether to change their predefined schedule to observe it or not.
The above Kafka message can be interpreted as follows:
The notice was issued on Thursday, May 24, 2024, at 23:51:21 Universal Time. It specifies the satellite's next pointing direction, which is characterized by its Right Ascension (RA) and Declination (Dec) coordinates in the sky, both given in degrees and in the J2000 epoch. The RA is 213.1104 degrees, and the Dec is +47.355 degrees. The spacecraft's roll angle for this direction is 342.381 degrees. The satellite will slew to this new position at 83760.00 seconds of the day (SOD), which translates to 23:16:00.00 UT. The planned observation time is 60 seconds.
The name of the target for this observation is "URAT1-687234652," with a merit value of 51.00. The merit value indicates the target's priority, which helps in planning and prioritizing observations, especially when multiple potential targets are available.
Latency and frequency
Using the Kafka settings above with startingOffsets => 'earliest', the pipeline will consume all existing data from the Kafka topic. This configuration allows you to process existing data immediately, without waiting for new messages to arrive.
While gamma-ray bursts are rare events, occurring roughly once per million years in a given galaxy, the vast number of galaxies in the observable universe results in frequent detections. Based on my own observations, new messages typically arrive every 10 to 20 minutes, providing a steady stream of data for analysis.
Streaming data is often misunderstood as being solely about low latency, but it's actually about processing an unbounded flow of messages incrementally as they arrive. This allows for real-time insights and decision-making.
The GCN scenario demonstrates an extreme case of latency. The events we're analyzing occurred billions of years ago, and their gamma rays only reached us now.
It's likely the most dramatic example of event-time to ingestion-time latency you'll encounter in your career. Yet, the GCN scenario remains a great streaming data use case!
DLT materialized views for complex transformations
In the next step, I had to get this Character Large OBject (CLOB) of a Kafka message into a schema to be able to make sense of the data. So I needed a SQL solution to first split each message into lines and then split each line into key/value pairs using the pivot method in SQL.
I utilized the Databricks Assistant and our own DBRX large language model (LLM) from the Databricks playground for support. While the final solution is a bit more complex with the full code available in the repo, a basic skeleton built on a DLT materialized view is shown below:
The approach above uses a materialized view that divides each message into proper columns, as seen in the following screenshot.
Materialized views in Delta Live Tables are particularly useful for complex data transformations that need to be performed repeatedly. Materialized views allow for faster data analysis and dashboards with reduced latency.
Databricks Assistant for code generation
Tools like the Databricks Assistant can be incredibly useful for generating complex transformations. These tools can easily outperform your SQL skills (or at least mine!) for such use cases.
Pro tip: Helpers like the Databricks Assistant or the Databricks DBRX LLM don't just help you find a solution; you can also ask them to walk you through their solution step by step using a simplified dataset. Personally, I find this tutoring capability of generative AI even more impressive than its code generation skills!
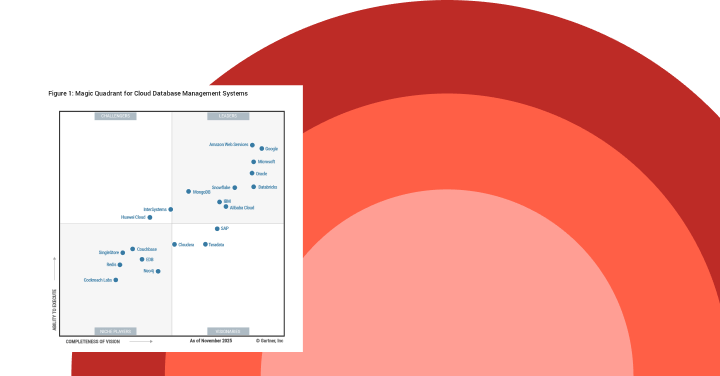
Gartner®: Databricks Cloud Database Leader
Analyzing Supernova Data With AI/BI Genie
If you attended the Data + AI Summit this year, you would have heard a lot about AI/BI. Databricks AI/BI is a new type of business intelligence product built to democratize analytics and insights for anyone in your organization. It consists of two complementary capabilities, Genie and Dashboards, which are built on top of Databricks SQL. AI/BI Genie is a powerful tool designed to simplify and enhance data analysis and visualization within the Databricks Platform.
At its core, Genie is a natural language interface that allows users to ask questions about their data and receive answers in the form of tables or visualizations. Genie leverages the rich metadata available in the Data Intelligence Platform, also coming from its unified governance system Unity Catalog, to feed machine learning algorithms that understand the intent behind the user's question. These algorithms then transform the user's query into SQL, generating a response that is both relevant and accurate.
What I love most is Genie's transparency: It displays the generated SQL code behind the results rather than hiding it in a black box.
Having built a pipeline to ingest and transform the data in DLT, I was then able to start analyzing my streaming table and materialized view. I asked Genie numerous questions to better understand the data. Here's a small sample of what I explored:
- How many GRB events occurred in the last 30 days?
- What is the oldest event?
- How many occurred on a Monday? (It remembers the context. I was talking about the number of events, and it knows how to apply temporal conditions on a data stream.)
- How many occurred on average per day?
- Give me a histogram of the merit value!
- What is the maximum merit value?
Not too long ago, I would have coded questions like "on average per day" as window functions using complex Spark, Kafka or even Flink statements. Now, it's plain English!
Last but not least, I created a 2D plot of the cosmic events using their coordinates. Due to the complexity of filtering and extracting the data, I first implemented it in a separate notebook, because the coordinate data is stored in the celestial system using somehow redundant strings. The original data can be seen in the following screenshot of the data catalog:
You can provide instructions in natural language or sample queries to enhance AI/BI's understanding of jargon, logic and concepts like the particular coordinate system. So I tried this out, and I provided a single instruction to AI/BI on retrieving floating-point values from the stored string data and also gave it an example.
Interestingly, I explained the task to AI/BI as I would to a colleague, demonstrating the system's ability to understand natural, conversational language.
To my surprise, Genie was able to recreate the entire plot — which had originally taken me an entire notebook to code manually — with ease.
This demonstrated Genie's ability to generate complex visualizations from natural language instructions, making data exploration more accessible and efficient.
Summary
- NASA's GCN network provides amazing live data to everyone. While I was diving deep into supernova data in this blog, there are literally hundreds of other (Kafka) topics out there waiting to be explored.
- I provided the full code so you can run your own Kafka client consuming the data stream and dive into the Data Intelligence Platform or use open source Apache Spark.
- With the Data Intelligence Platform, accessing supernova data from NASA satellites is as easy as copying and pasting a single SQL command.
- Data engineers, scientists and analysts can easily ingest Kafka data streams from SQL using
read_kafka(). - DLT with AI/BI is the underestimated power couple in the streaming world. I bet you will see much more of it in the future.
- Windowed stream processing, typically implemented with Apache Kafka, Spark or Flink using complex statements, could be greatly simplified with Genie in this case. By exploring your tables in a Genie data room, you can use natural language queries, including temporal qualifiers like "over the last month" or "on average on a Monday," to easily analyze and understand your data stream.
Resources
- All solutions described in this blog are available on GitHub. To access the project, clone the TMM repo with the cone pattern
NASA-swift-genie - For more context, please watch my Data + AI Summit session From Supernovas to LLMs which includes a demonstration of a compound AI application that learns from 36,000 NASA circulars using RAG with DBRX and Llama with LangChain (check out the mini blog).
- You can find all the playlists from Data + AI Summit on YouTube. For example, here are the lists for Data Engineering and Streaming and Generative AI.
- Read more about Delta Live Tables
- Read more about AI/BI
- Read more about the Data Intelligence Platform
Next Steps
Nothing beats first-hand experience. I recommend running the examples in your own account. You can try Databricks free.